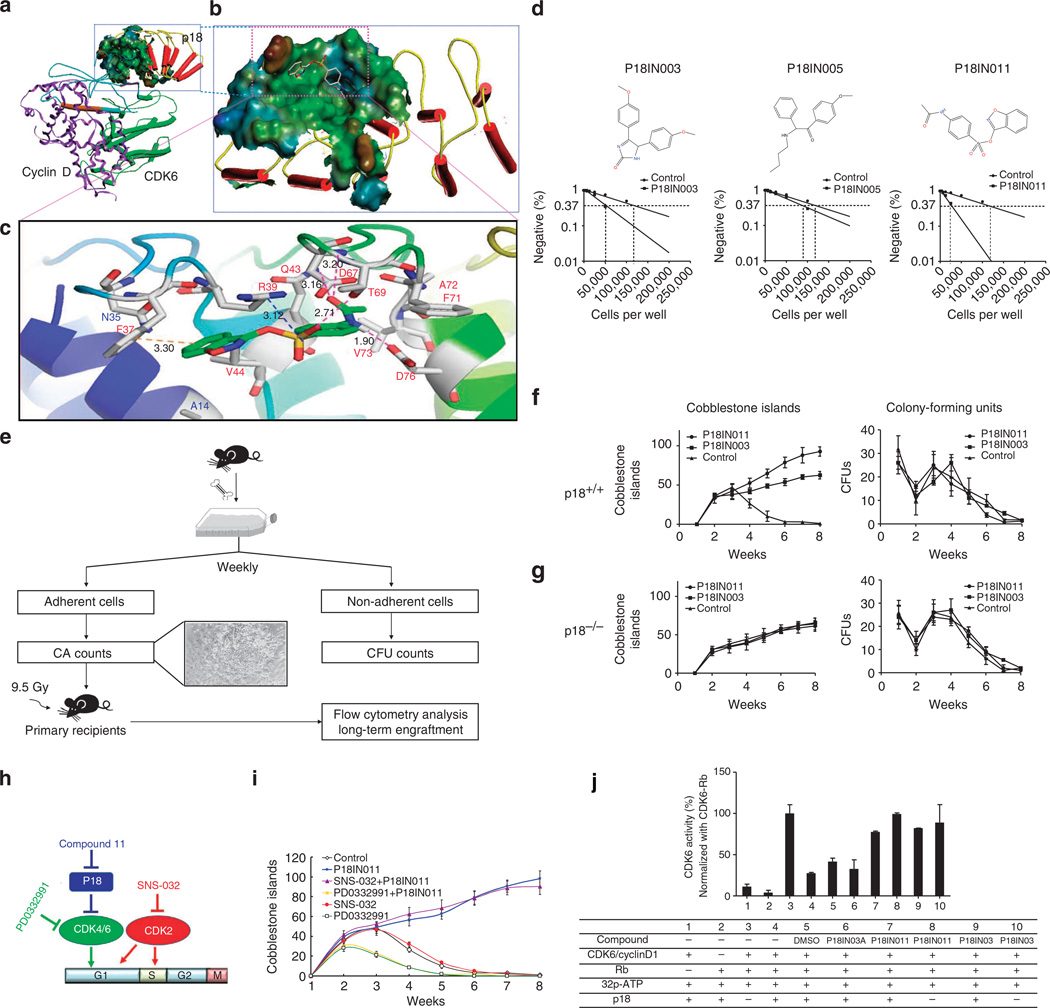
Figure 3. In-silico screening for p18-specific small-molecule inhibitors.
(a) 3D structural model of the p18/CDK6/CylinD complex (left) and the p18-binding surface cavity (right), showing that p18 (red colour) binds to CDK6 (green) at the site opposite cyclin-D (purple). (b) A docking pose of P18IN011, depicting hydrogen bonding and hydrophobic interactions between P18IN011 and the key residues of the p18 protein. (c) Putative interactions between P18IN011 and p18 residues. (d) The structure of the lead compounds and the limit dilution analysis of groups treated with different compounds. (e) Experimental design of Dexter-type long-term cultures of BMNCs. The data were from one of two experiments yielding similar results. A specific effect of p18 small-molecular inhibitors on p18+/+ (f) haematopoietic cells, but not on p18−/− (g) haematopoietic cells, during long-term BM culture. Freshly isolated BMNCs from p18+/+ mice or p18−/− mice were cultured in the Dexter’s culture medium presence or absence of the lead compounds and the cobblestone area (CA) number was counted each week (left). Non-adherent cells from the old medium were seeded in 0.5 ml of M3434 (StemCell Technologies) supplemented with recombinant cytokines (50 ng ml−1 of SCF, 10 ng ml−1 of IL-3, 10 ng ml−1 of IL-6 and 3 U ml−1 of EPO). The cells were plated in a 1.7-cm dish (n = 5) at a fixed density. The existence of CFUs in each well was counted weekly (right). (h) A model of cell-cycle regulation by p18 and CDKs. (i) Specific dependence of p18 inhibitor compounds on CDK4/6, but not on CDK2. (j) CDK6 activity assay in vitro. Recombinant Rb fragments were used as substrates for the activated complexes of CDK6/CyclinD1. P-labelled GST-Rb was quantitatively analysed by a scintillation counter and normalized with the mean of the CDK6-Rb group. P18IN3A was used as a negative control. Data sets were analysed using one-way analysis of variance (GraphPad Prism v6.0). All data represent mean ± s.d. in different groups. *P < 0.05, **P < 0.01.

