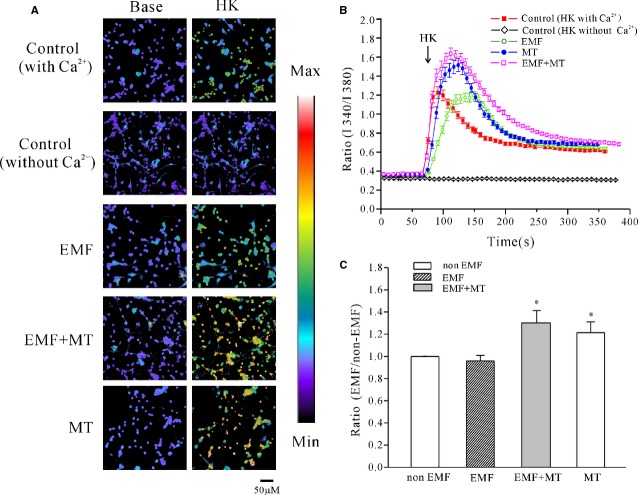
Figure 6.
Effect of melatonin (MT) on the increase in intracellular Ca2+ level induced by high K+ in control cells and cells exposed to extremely low-frequency electromagnetic field (ELF-EMF). (A) [Ca2+] imaging obtained before and after depolarizing membranes by acute perfusion of a solution containing 27 mM K+ from ELF-EMF exposure and control cerebellar granule cells (GCs) in the presence or absence of MT. Changes in the fura-2 AM fluorescence excitation ratios with increasing [Ca2+] are depicted as a switch from purple to red; scale bar, 50 μm. (B) Changes in intracellular Ca2+ concentrations upon application of a depolarizing stimulus as measured by quantification of fluorescence excitation ratios. Each arrow represents a 30-sec. perfusion with a depolarizing solution containing 27 mM K+. (C) Statistical analysis of intracellular Ca2+ level obtained fromELF-EMF-exposed and control cerebellar GCs in the presence or absence of MT. The data were obtained from four independent experiments and are the means ± SEM; *P < 0.05 compared with the corresponding control by unpaired t-test.

