Figure 4.

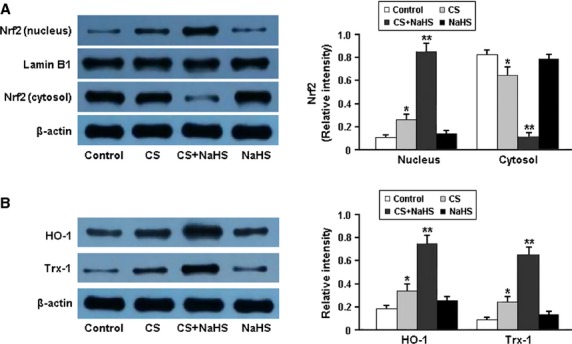
Representative immunoblots and densitometric analysis of Nrf2 in nucleus and cytosol (A) and its downstream targets HO-1 and Trx-1 (B). *P < 0.05 versus Control; **P < 0.05 versus CS.

Representative immunoblots and densitometric analysis of Nrf2 in nucleus and cytosol (A) and its downstream targets HO-1 and Trx-1 (B). *P < 0.05 versus Control; **P < 0.05 versus CS.