
Figure 5.
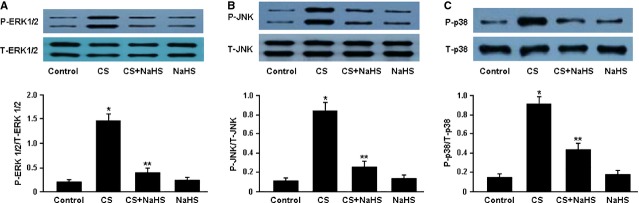
Representative immunoblots and densitometric analysis of phosphorylated ERK1/2 and total ERK1/2 (A), phosphorylated JNK and total JNK (B), phosphorylated p38 and total p38 (C). *P < 0.05 versus Control; **P < 0.05 versus CS.
Official websites use .gov
A
.gov website belongs to an official
government organization in the United States.
Secure .gov websites use HTTPS
A lock (
) or https:// means you've safely
connected to the .gov website. Share sensitive
information only on official, secure websites.
Representative immunoblots and densitometric analysis of phosphorylated ERK1/2 and total ERK1/2 (A), phosphorylated JNK and total JNK (B), phosphorylated p38 and total p38 (C). *P < 0.05 versus Control; **P < 0.05 versus CS.