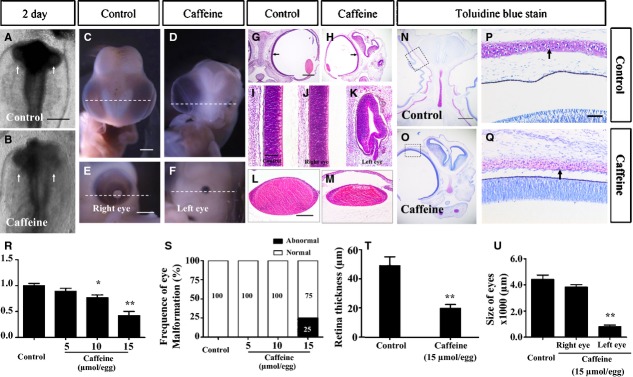
Figure 1.

Caffeine exposure causes eye dysplasia in early chick embryos. HH5 chick embryos were injected with 15 μmol/egg caffeine for 12 hrs or HH10 chick embryos were injected with 5–15 μmol/egg for 7.5 days. All images are derived from control and 15 μmol/egg caffeine-treated embryos. (A and B) Head regions of 2-day-old control (A) and caffeine-treated (B) chick embryos. The optic vesicles are indicated by white arrows. (C and D) Ventral view of embryonic 9-day-old control (C) and caffeine-treated (D) head regions, showing excess caffeine induces unilateral microphthalmia. (E and F) Higher magnification of D showing the normal right eye (E) and smaller left eye (F). (G and M) Haematoxylin and eosin staining of transverse sections from C and D (dotted white line), showing the histology of control (G) and caffeine-treated (H) embryo head regions. (I) Histology of the control retina in G. (J and K) Appearance of the caffeine-treated retinas and lenses in the right (J and L respectively) and left (K and M respectively) of H. (N and O) Toluidine blue stained transverse sections (white dotted lines) of C and D respectively. (P and Q) Framed regions in N and O respectively, showing the orbital bone (black arrows) in the caffeine-treated embryos are less developed when compare with those of control embryos. (R–U) Bar charts showing caffeine significantly reduced the weight of the developing embryos (R), significantly increased the incidence of eye malformation (S), decreased the thickness of the whole retina (T) and reduced the size (diameter) of the eyes (U). *P ≤ 0.05 and **P ≤ 0.01 are significant difference between control and caffeine-treated embryos. Scale bars = 500 μm in A and B; 2 mm in C and D, E and F; 1 mm in G and H, N and O; 50 μm in I and K; 100 μm in L and M, P and Q.
