
Figure 8.
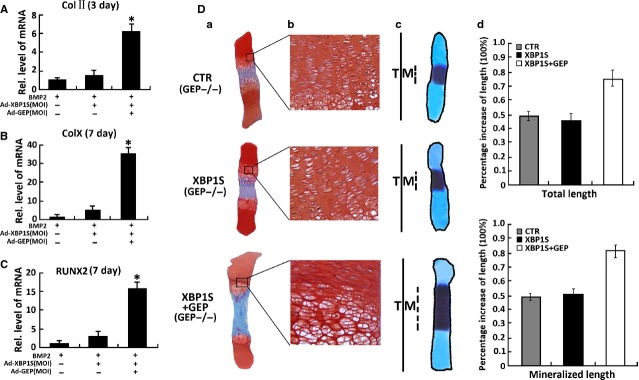
Granulin-epithelin precursor (GEP) is required for the XBP1S-induced chondrocyte differentiation and endochondral bone formation. (A) XBP1S stimulates chondrocyte differentiation through GEP. Micromass culture of GEP−/− bone marrow stromal cells (BMSC) infected with or without Ad-XBP1S (MOI 20) and Ad-GEP (MOI 20) for 3 days was used to test whether BMP2 (300 ng/ml)-induced chondrogenesis is GEP dependent. Expressions of marker genes Col II, as indicated, were determined by real-time PCR; (B) Micromass culture of GEP−/− BMSC cells infected with or without Ad-XBP1S (MOI 20) and Ad-GEP (MOI 20) for 7 days was used to test whether BMP2 (300 ng/ml)-induced chondrogenesis is GEP dependent. Expressions of marker genes Col X, as indicated, were determined by real-time PCR; (C) Micromass culture of GEP−/− BMSC cells infected with or without Ad-XBP1S (MOI 20) and Ad-GEP (MOI 20) for 7 days was used to test whether BMP2 (300 ng/ml)-induced chondrogenesis is GEP dependent. Expressions of marker genes RUNX2, as indicated, were determined by real-time PCR; (D) XBP1S increased BMP2-induced chondrocyte hypertrophy, mineralization and bone length through GEP. (a and b) Safranin O-fast green staining of metatarsals. Metatarsals were explanted from 15-day-old GEP null mouse embryos and cultured in the absence (CTR) or presence of Ad-XBP1S (MOI 20), Ad-GEP (MOI 20). The explants were cultured for 5 days, and safranin O-fast green staining was observed by using low-power (a) or high-power (b) microphotography. (c) Alizarin red S and alcian blue staining of metatarsals. Metatarsals were cultured as described above and processed for alizarin red S and alcian blue staining; a representative photograph is presented. (d) Per cent increase in total and mineralization length of metatarsal bones. Metatarsals were cultured as described above, total or mineralization length was determined, and the per cent increase was calculated (per cent increase = [length at day 5 − length at day 0]/length at day 0). Asterisk indicates a significant difference from the control (P < 0.05).