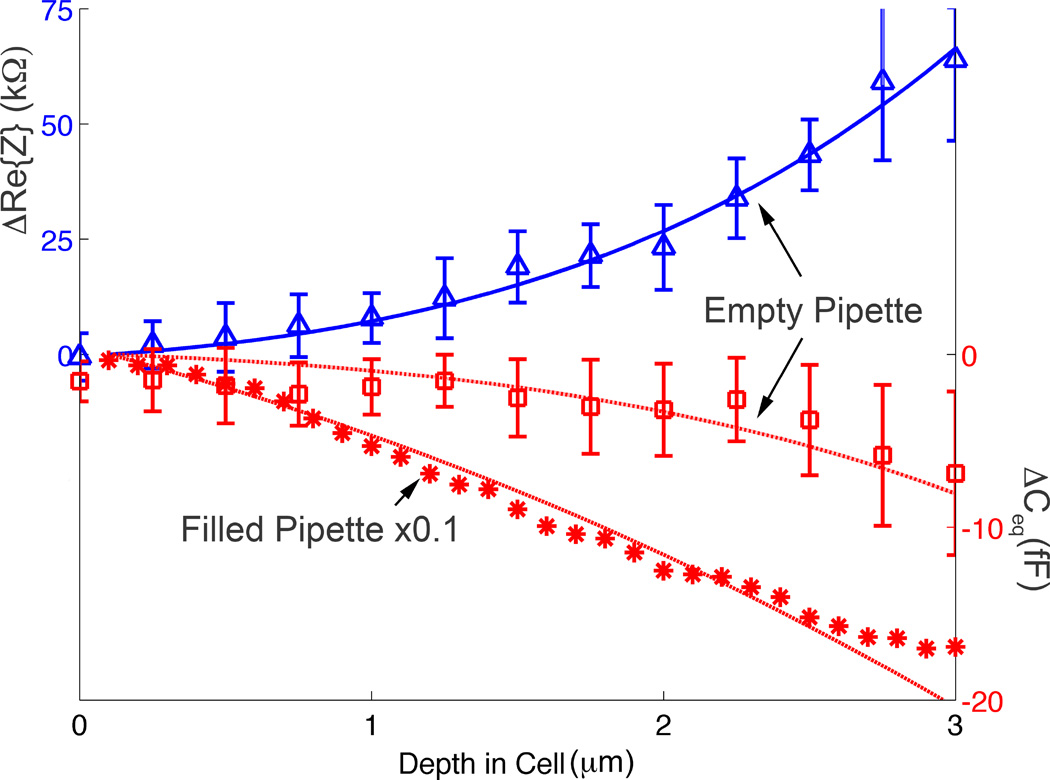
Figure 4.
The real part of the change in the impedance ΔRe{Z} (blue triangles, empty CNP, n=10), ΔCeq (red hollow squares, empty CNP, N=10), and ΔCeq (red stars, liquid-filled CNP, N=1) are depicted as functions of the cell penetration depth (d µm) into the cytoplasm. The symbols and lines represent, respectively, experimental data and theoretical predictions.

