
Figure 4.
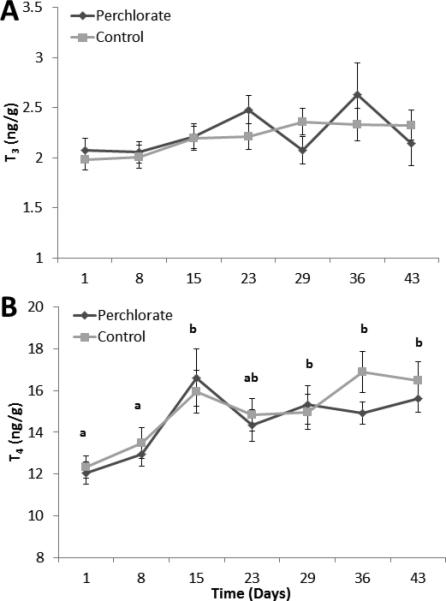
(A-B). Means ± SE for whole-body T3 (A) and T4 (B) in stickleback that were chronically exposed to 100 ppm perchlorate or control conditions and sampled at 1100 h across the reproductive season (May-July). Different letters indicate significant differences between groups evaluated by post-hoc Tukey HSD test (p<0.05) following ANOVA.