Figure 3.

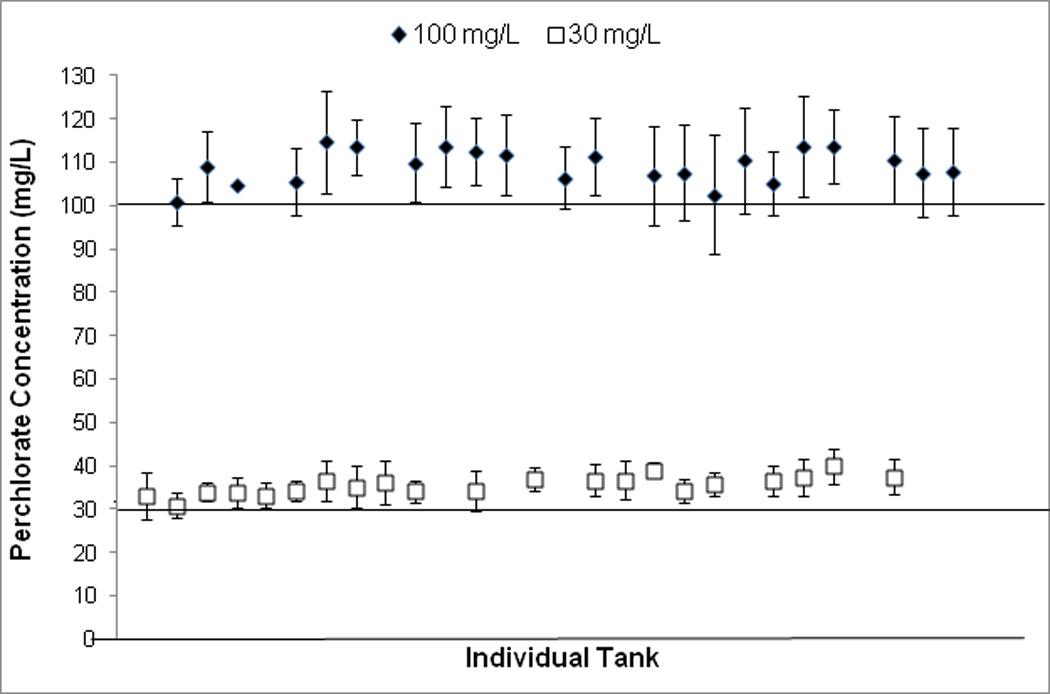
Mean ± SE perchlorate concentrations in individual aquaria over the course of the experiment (July 12, 2008- July 1, 2009). Each point represents one aquarium.

Mean ± SE perchlorate concentrations in individual aquaria over the course of the experiment (July 12, 2008- July 1, 2009). Each point represents one aquarium.