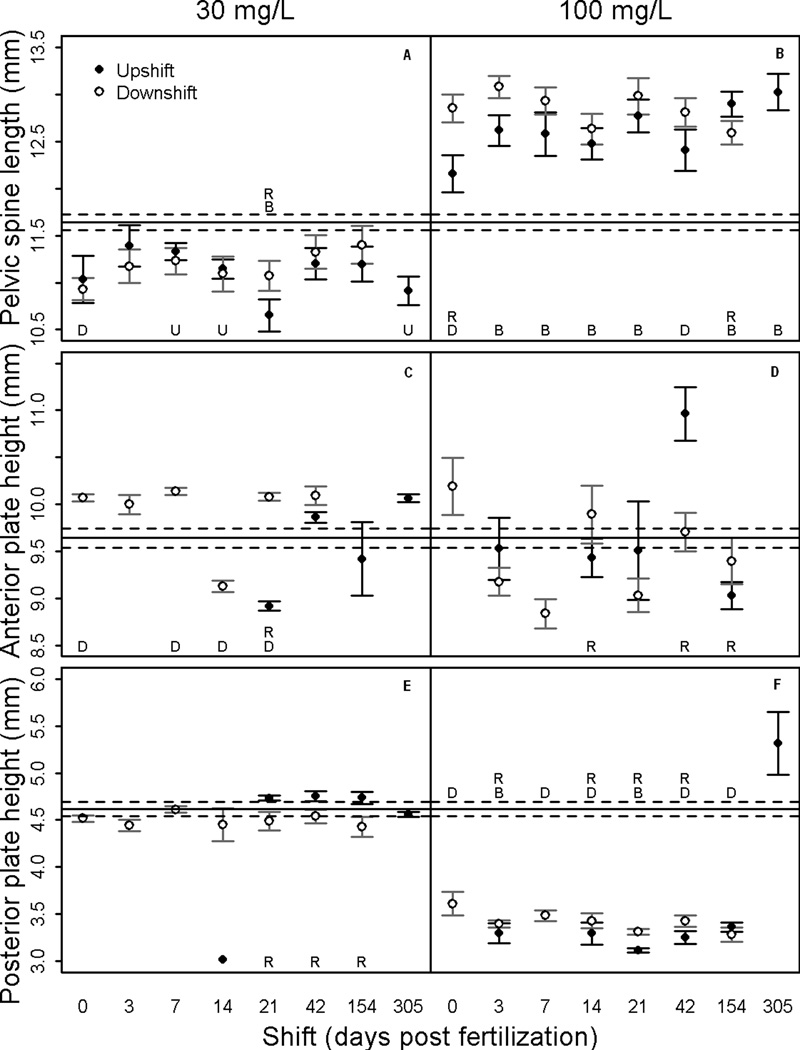
Figure 5.
Mean ± SE trait lengths of threespine stickleback in each treatment. Upshift = fish began in clean water and were transferred to contaminated water. Downshift = reciprocal of upshift. Significant differences at α<0.05 indicated by: (U) between upshift and control, (D) between downshift and control, (R) between upshift and downshift regimes. The solid horizontal line is the control mean and the dashed lines are the SE around the control mean.

