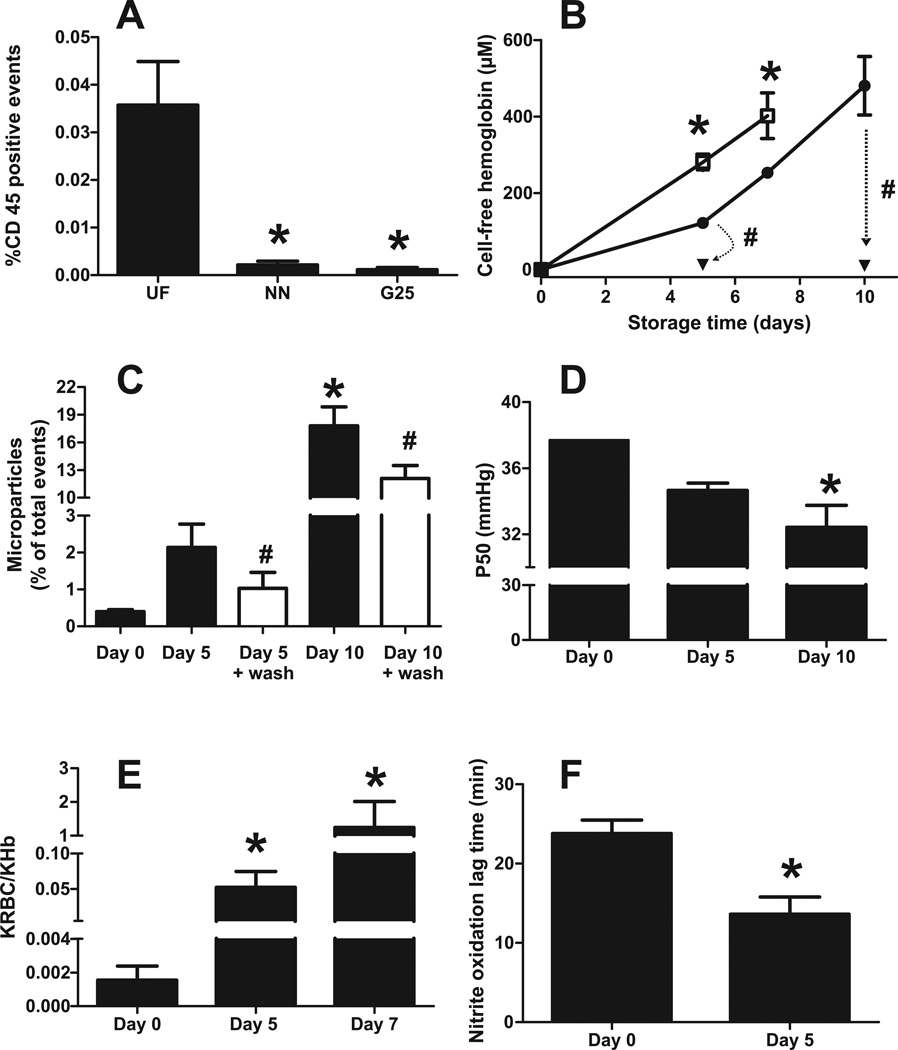
Figure 1. Characterization of murine RBC storage.
Panel A C57BL/6 blood was filtered by either Purecell NEO Neonatal High Efficiency Leukocyte Reduction Filter (Pall corporation) (NN) or by Sephadex G25: microcellulose column. (G25). Leukocyte content was determined by FACs and staining for the surface antigen CD45. * P< 0.05 compared to unfiltered (UF) by 1-way ANOVA with Tukey post test (n=3). Panel B: Storage time dependent hemolysis in control (non leukoreduced) RBC (□), leukoreduced (LR) RBC (●) or LR RBC after washing (▼), change indicated by dashed arrows *P<0.01 by 2-way ANOVA with Bonferroni post test (n = 3–9). #P<0.02 by paired t-test (n=3–6). Panel C: Storage time dependent formation of glycophorin positive microparticles in LR mRBC before and after washing. *P<0.01 by 1-way ANOVA with Tukey post test relative to day 0 unwashed RBC. #P<0.04 by paired t-test relative to respective unwashed RBC (n=3–6). Panel D Storage time dependent changes in P50. *P<0.05 relative to day 0 (n=3) by 1-way ANOVA with Tukey post test. Panel E shows relative rate constants for NO-dioxygenation by intra-erythrocytic (KRBC) hemoglobin vs. acellular hemoglobin (KHb) as a function of storage age. *P<0.05 relative to day 0 by 1-way ANOVA with Tukey post test (n=3–6). Panel F shows lag times for hemolysate mediated nitrite oxidation. *P<0.01 by t-test (n=5).

