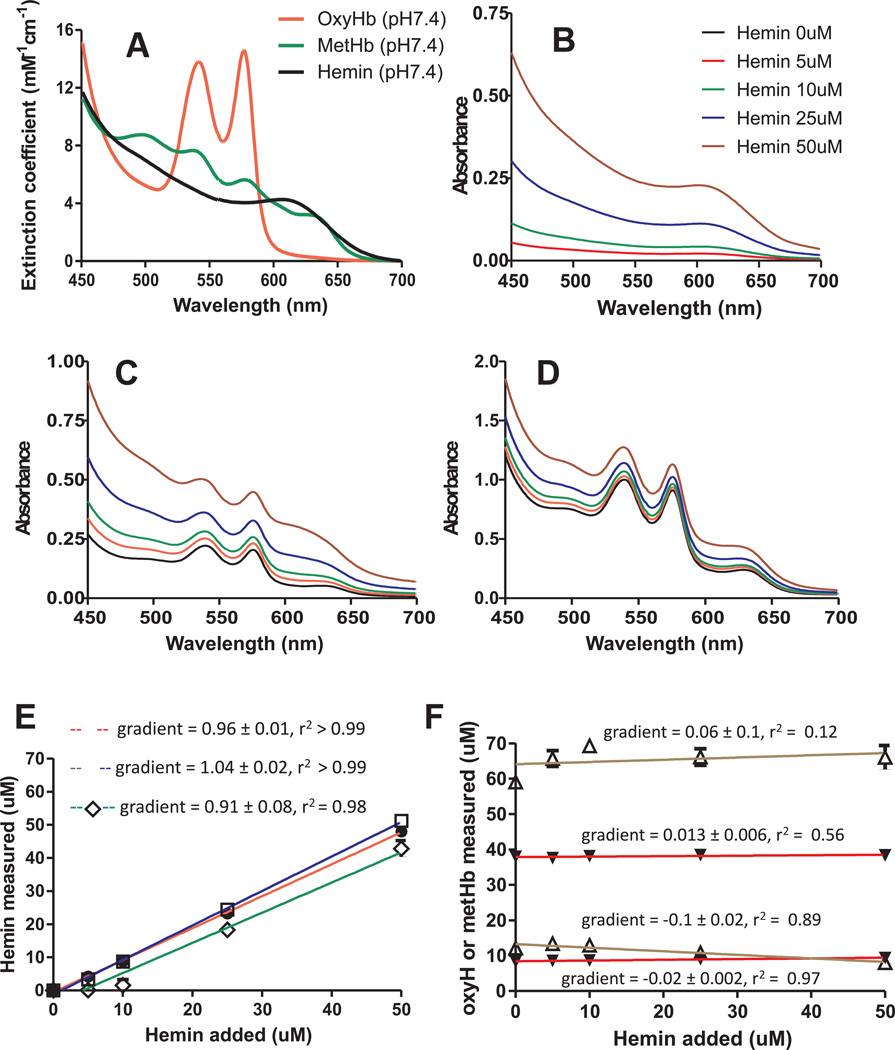
Figure 2.
Standard spectra for oxyhemoglobin, methemoglobin, and hemin in Adsol buffer, pH 7.4 (Panel A). Solutions of hemin alone (0–50µM) or in combination with oxyHb (10µM) + metHb 10µM or with oxyHb 40µM + metHb (60µM) were prepared in Adsol at pH 7.4 and spectra measured (Panel B–D respectively). Spectra were deconvoluted and calculated hemin (Panel E) and oxyHb and metHb (panel F) plotted vs hemin added. Deconvolution analysis was performed using standard spectra shown in Figure 2. Data in panels E–F were fitted by linear regression and are mean ± STDEV (n=3). Gradients determined from regression fit are indicated on respective plots. Key: Panel E: ● = hemin alone group, □ = hemin + oxyHb (10µM) + metHb (10µM) group; ◊ = hemin + oxyHb (50µM) + metHb (50µM) group. Panel F: ▼ = oxyHb, Δ= metHb.

