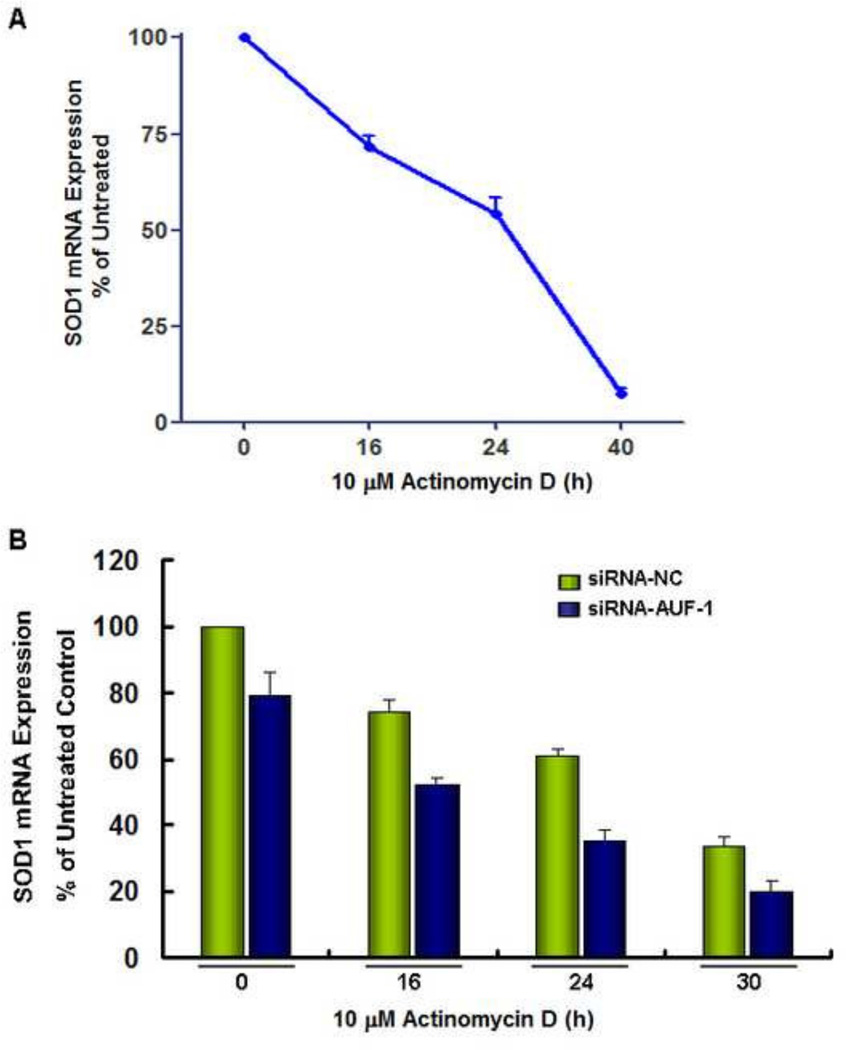
Figure 7. AUF-1 regulates SOD1 mRNA expression in A2780 cells.
(A). Cells were treated with actinomycin D (10 µM) for 16–40 h. Total RNA was isolated and SOD1 mRNA levels were determined by real-time RT-PCR analysis. The SOD1 mRNA level in untreated control cells was equivalent to that amplified from 2.3 ng cDNA. (B). Cells with AUF-1 siRNA knockdown were treated with actinomycin D (10 µM) for 16–30 h. Total RNA was isolated and SOD1 mRNA levels were determined by real-time RT-PCR analysis. The SOD1 mRNA level in untreated control cells was equivalent to that amplified from 2.8 ng cDNA. Data (mean ± SEM) are representative of two individual experiments conducted in triplicate.

