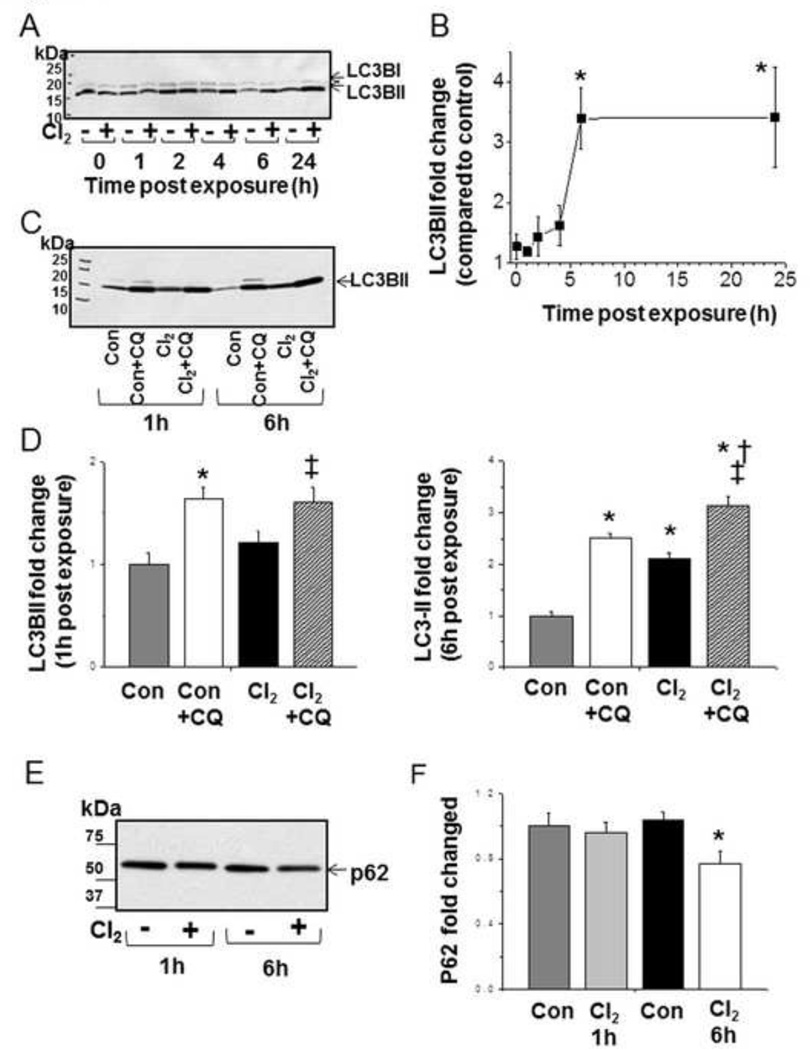
Figure 5. Cl2 induces autophagy in H441 cells.
H441 cells were exposed to either air or Cl2 100 ppm/15 minutes and returned to 95% air, 5% CO2. Cells were lysed at time points indicated: 0, 1, 2, 4, 6, and 24 h post Cl2 exposure. Equal amounts of protein were loaded on the 4–20% SDS Page gel. (A) Western blots with a primary antibody against LC3B. Both LC3-I and LC3-II bands, indicated by the upper and lower arrows, are shown for the indicated times post exposure to Cl2 (+) or 95% air/5% CO2 (-). (B) Quantitation of LC3BII band (expressed as % increase of the corresponding 95%air/5% CO2 value for the same time interval). Values are means ± SEM; n=4–5 for each time point, * p<0.05 compared to the air value. (C) Western blots for LC3B after incubation of H411 cells with chloroquine (CQ; 40 µM) for 2 h or control prior to exposure to Cl2 (100 ppm, 15 min) and returned to 95%air/5% CO2 for the indicated periods of time (1 and 6 h). (D) Quantification of Western blots shown in C. (E) Typical Western blots for p62 at 1 and 6 h post Cl2 exposure. Control (-) or Cl2 (+; 100 ppm/15 min). (F) Quantification of western blots (fold increase compared to corresponding control values). Values are mean ± SEM.; n=5–6 per condition, *p <0.05 compared to control, † p <0.05 compared to control + CQ, ‡ p <0.05 compared to chlorine.

