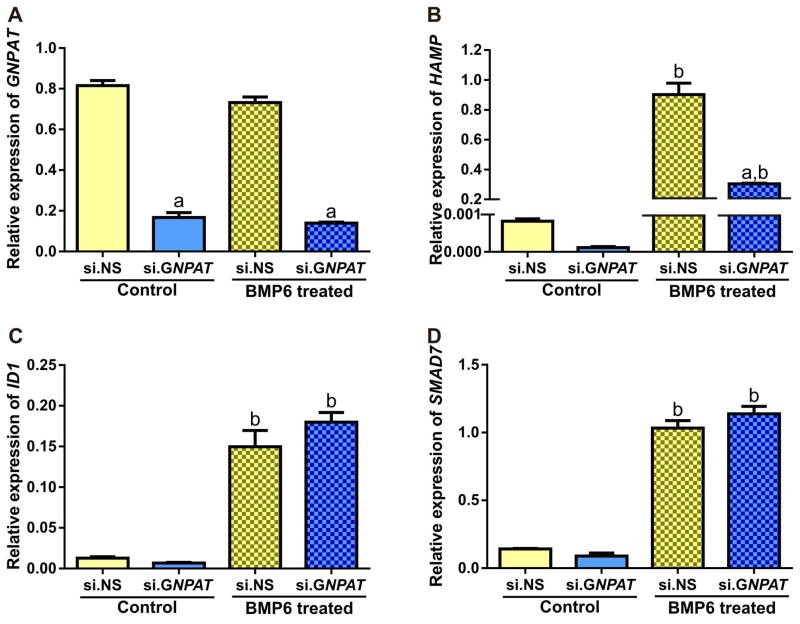
Figure 4. Representative graphs of siRNA mediated knockdown of GNPAT in HepG2/C3A either treated with or without BMP6.
HepG2/C3A cells were treated with control (si.NS) or GNPAT-specific siRNA (si.GNPAT). Cells were serum starved for 6 hours and then treated with vehicle or BMP6 (10ng/mL for four hours). Experiments were performed four times. Relative expressions of (A) GNPAT, (B) HAMP, (C) ID1 and (D) SMAD7 mRNA were analyzed using qPCR and normalized to the geometric means of ACTB and HPRT1. Error bars represent the standard error of the mean (SEM). P-values for fold change were calculated using two-way ANOVA with a Bonferroni multiple comparison test post-hoc with multiplicity adjusted P-values; a = p<0.0001 comparing si.GNPAT to si.NS within treatment group, b = p<0.001 comparing control to BMP6 treated within si.RNA group.

