Abstract
Background
Several scar-scoring scales exist to clinically monitor burn scar development and maturation. Although scoring scars through direct clinical examination is ideal, scars must sometimes be scored from photographs. No scar scale currently exists for the latter purpose.
Materials and methods
We modified a previously described scar scale (Yeong et al., J Burn Care Rehabil 1997) and tested the reliability of this new scale in assessing burn scars from photographs. The new scale consisted of three parameters: scar height, surface appearance, and color mismatch. Each parameter was assigned a score of 1 (best) to 4 (worst), generating a total score of 3 to 12. Five physicians with burns training scored 120 representative photographs using the original and modified scales. Reliability was analyzed using coefficient of agreement, Cronbach’s alpha, intraclass correlation coefficient, variance, and coefficient of variance. Analysis of variance was performed using the Kruskal-Wallis test. Color mismatch and scar height scores were validated by analyzing actual height and color differences.
Results
The intraclass correlation coefficient, the coefficient of agreement, and Cronbach’s alpha were higher for the modified scale than the original scale. The original scale produced more variance than the modified scale. Sub-analysis demonstrated that, for all categories, the modified scale had greater correlation and reliability than the original scale. The correlation between color mismatch scores and actual color differences was 0.84 and between scar height scores and actual height was 0.81.
Conclusions
The modified scar scale is a simple, reliable, and useful scale for evaluating photographs of burn patients.
Keywords: Scar, Scale, Burn, Photograph, Hypertrophic Scar
1. Introduction
Burn treatment has improved dramatically in recent decades. Early excision and grafting of burn wounds has greatly reduced morbidity and mortality [1, 2]. Unfortunately, pathological scarring affecting both function and cosmesis remains common place in burn patients, often delaying reintegration of these individuals into society. Improved outcomes have shifted greater attention to wound and scar management in an attempt to improve aesthetic and functional results. Evaluation of aesthetic results depends upon the ability to assess the evolution of scars over time as well as the outcomes of corrective interventions. This requires scar scoring methods that are simple, reliable, and objective. Several scar scores have been described [3–5], with the Vancouver scale being the most widely used in clinical practice [6]. However, an ideal scoring system has yet to be developed.
Scoring scars through direct clinical examination is vital and irreplaceable. However, photographs of patients are commonly used in clinical practice to score scars, either because it is the only option or more convenient. Some scales have been applied to patient photographs to measure reliability between observers [7–10]. Unfortunately, these clinic-based scales are not specifically designed for analysis of patient photographs and may not be appropriate for this purpose. Development of a simple and reliable system to assess scars in photographs would be extremely useful from both a clinical and a research standpoint. Reliable comparisons over time, by multiple observers who may be blinded to treatment interventions, would be possible with a scale developed specifically for photographic evaluation. Objective, blinded analysis of a large number of patients enrolled in clinical studies would also be possible. Yeong et al. [8] described a very reliable clinic-based scar scoring system that relies on assessments of four scar characteristics. Here, we describe a modification of this scale to obtain a simple and highly reliable score system for the assessment of photographs of burn patients. Validation of the method was performed to demonstrate utility for future studies.
2. Methods
2.1. Photographs
The study was approved by the Institutional Review Board of the University of Texas Medical Branch, and written informed consent was obtained from patients, parents, or legal guardians prior to enrollment. One-hundred twenty representative photographs of 40 severely burned patients admitted to our hospital from 2000 to 2008 were selected by a plastic surgeon who did not participate in the scoring. Representative photographs from 6, 12, and 24 months after burn injury were selected so that different stages of scar maturation and hypertrophy could be presented to observers and the full-spectrum of scoring could be tested. All photographs were taken in the medical photography department at our hospital using standard lighting conditions as well as a standard background and distance. Photographs were taken using two Photogenic Powerlight 600s located 9 feet from the subject and set at 58, 2 white umbrellas (Photogenic Professional Lighting, IL) reflecting 6 feet, and a Nikon D200 camera with a Nikon 105 mm f/2.8 AF Micro lens (Nikon Inc., NY), which was set to Manual: ISO 160, 1/60 at f10. The focal length was adjusted in accordance with the patient’s height. The photographer was located between the two Powerlights and 9 feet from the patient, who was standing 3 feet in front of a standard surgical blue background. Color control patches (Eastman Kodak Company, Rochester, NY) were used to calibrate color. All photographs were stored digitally and then randomly ordered in a PowerPoint slideshow (Microsoft Office Power point 2003 SP3, Microsoft Corporation, Redmond, WA). The representative scar was outlined, and a full picture of the patient was included to illustrate the normal skin for comparison purposes (Fig. 1).
Fig. 1.
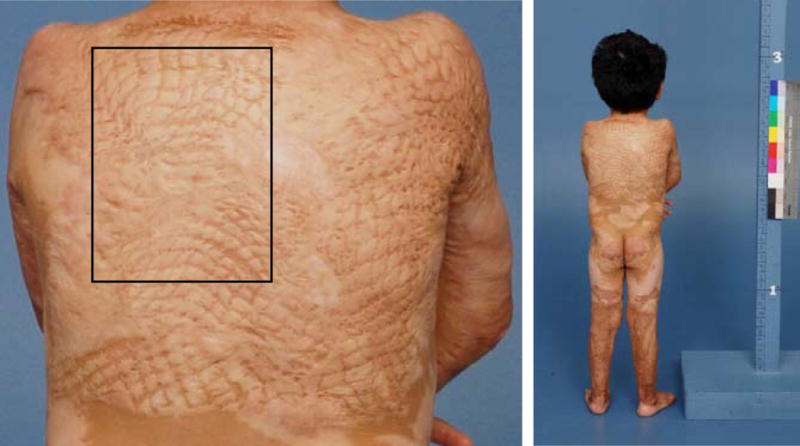
Example of a slide presented to observers. The studied area was outlined, and normal skin was included in the photograph for comparison. If necessary, a zoom-out or a picture of the entire patient was included in the same slide.
2.2. Scoring
Five physicians with burns training scored all patient photographs. These observers were provided with a reference chart for the scale (the original or modified scale, see description below). The reference chart included sample pictures of each category (Figs. 2 and 3). The observers scored the photographs in two separate sessions (one session for each scale), with the sessions being separated by a 4-month interval. The observers were blinded to the identity of the patients and time point of the photograph. This, taken with the random order of the slides, ensured that any bias in the scoring would be minimized. The slideshow was identical in both sessions. The scores were captured in a database file (Microsoft Office Access 2003, Microsoft Corporation, Redmond, WA) for further analysis.
Fig. 2.
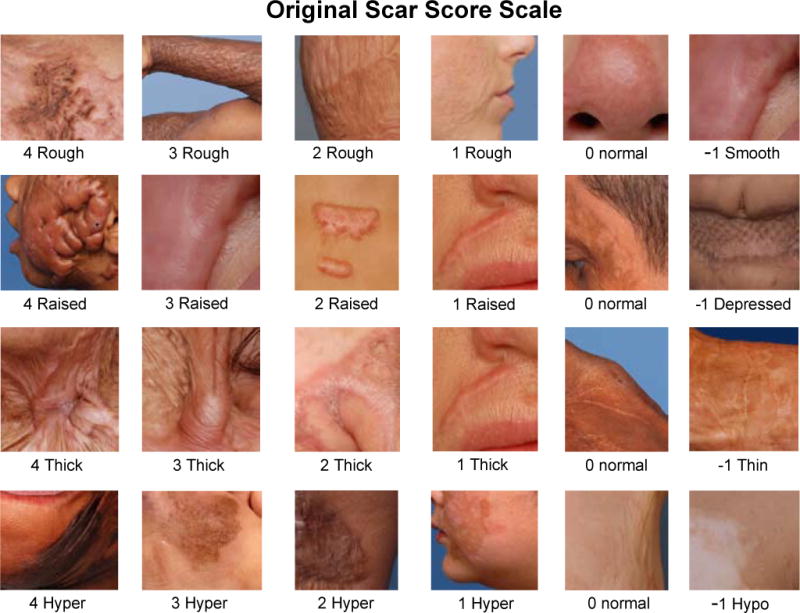
Original scale teaching chart. The teaching chart, which was provided to observers, contained sample pictures for every category.
Fig. 3.
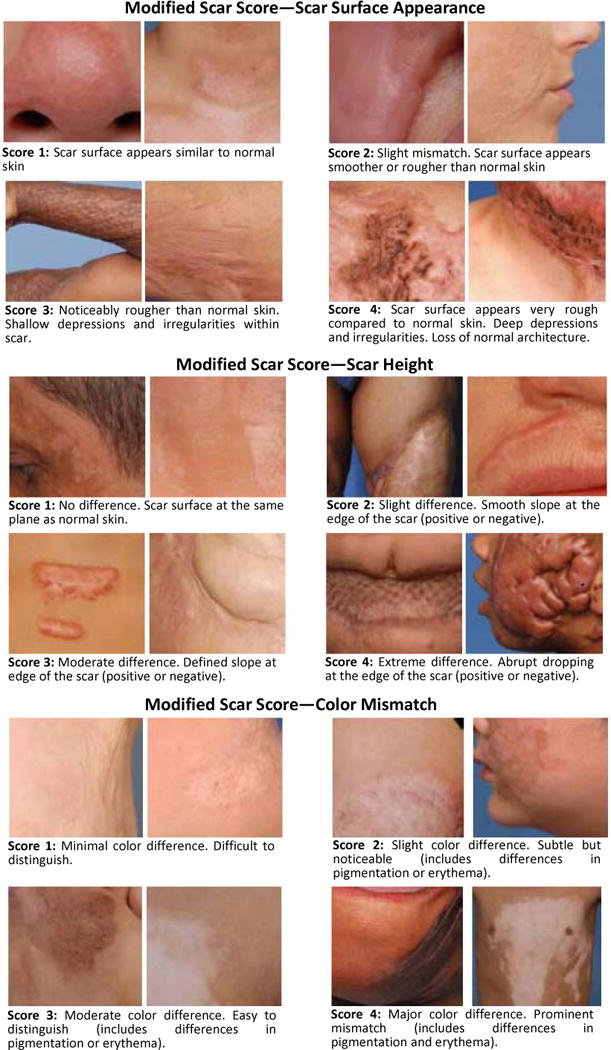
Modified scale teaching chart. The teaching chart contained sample photographs for scar surface appearance, scar height, and color mismatch. A brief description of the characteristics of each score was provided.
2.3. Scar-scoring scales
The original scale described by Yeong et al. [8] grades four characteristics of the scar: surface, thickness, border height, and color differences. In this scale, each category is assigned a score ranging from −1 to 4, yielding a final total score of −4 to 16 (Fig. 4).
Fig. 4.
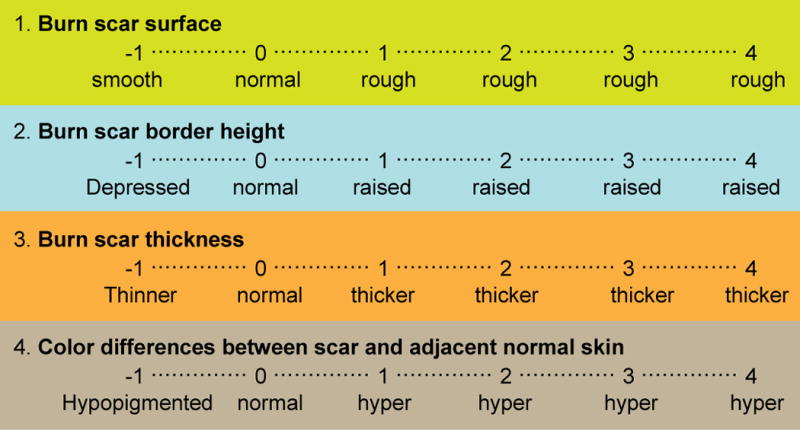
Scar score scale described by Yeong et al. [8]. Four characteristics of the scars are scored from −1 to 4, for a total score ranging from −4 to 16.
We modified the original scale of Yeong et al. [8] to increase reproducibility. This modified scale included characteristics that describe the general appearance of the scars [11]. In this scale, three scar characteristics were assessed: color mismatch, surface appearance, and scar height. Scar thickness in the original scale was omitted due to difficulty in reliably assessing this from only patient photographs. Each category received a score ranging from 1 to 4. This generated a total possible score of 3 to 12, which described the general appearance of the scar. The lower the score, the better the overall appearance of the scar and vice versa. Negative numbers on the scale, which also indicated a deviation from normal, were eliminated since negative numbers would decrease the final score and falsely imply a better scar appearance. Finally, the score started at 1 rather than 0 for “normal,” as it was felt that observers may exhibit reluctance in determining any scar to have a score of 0. A brief description of each score is provided in Table 1.
Table 1.
Modified Scale.
| Category | Score1 | Description |
|---|---|---|
| Scar Surface Appearance | 1 | Surface appearance: Similar to normal skin. |
| 2 | Surface appearance: Slight mismatch (smoother or rougher than normal skin). | |
| 3 | Surface appearance: Noticeably rougher than normal skin. Shallow | |
| 4 | Surface appearance: Very rough compared to normal skin. Deep depressions and irregularities. Loss of normal architecture. | |
|
| ||
| Scar Height | 1 | No difference. Scar surface at the same plane of the normal skin. |
| 2 | Slight difference. Smooth slope at the edge of the scar (positive or negative). | |
| 3 | Moderate difference. Defined slope at the edge of the scar (positive or negative). | |
| 4 | Extreme difference. Abrupt dropping at the edge of the scar (positive or negative). | |
|
| ||
| Color Mismatch | 1 | Color difference: Difficult to distinguish. |
| 2 | Color difference: Subtle but noticeable (Includes differences in pigmentation or erythema). | |
| 3 | Color difference: Moderate color difference. Easy to distinguish (Includes differences in pigmentation or erythema). | |
| 4 | Color difference: Major color difference. Prominent mismatch. (Include differences in pigmentation or erythema) | |
Each category is assigned a score from 1 to 4, for a total possible score of 3 to 12.
2.4. Validation of scar height and color mismatch scoring
Color mismatch and scar height scores were validated by analyzing actual height and color differences. The five observers’ color mismatch ratings were compared with actual color differences in digital photographs obtained using Adobe Photoshop and actual color differences in skin obtained using a scanning reflectance spectrophotometer with xenon flash lamps. Briefly, color differences in digital photographs were determined by obtaining the RGB (Red, Green, Blue) or CIELAB (CIE 1976 L*a*b*) values from Photoshop software and then calculating the Euclidean distance with these values (see Supplementary Methods for further description of Euclidean distance). Color differences in skin were also assessed by calculating the Euclidean distance, which was obtained using CIELAB readings from a spectrophotometer. The inter rater reliability between the methods of color mismatch determination was assessed by the intraclass correlation coefficient (ICC) (SPSS). A more detailed description of the methods used for color mismatch validation can be accessed in the Online Supplement (see Supplementary Methods and Supplementary Figs. 1 and 2).
2.5. Statistical analysis
Exact agreement between observers was determined using the coefficient of agreement (Po), calculated as the number of exact agreements/number of possible agreements [12]. ICC Model 2 form 1 [13] was used to test the reliability of each category (i.e., scar height, scar surface appearance, and color mismatch). For the mean values, we used Model 2, form 2 of the ICC to test reliability [13] (PASW Statistics 17.0. SPSS Inc. Chicago, IL). Reliability was calculated with Cronbach’s alpha (PASW Statistics 17.0. SPSS Inc., Chicago, IL). Variance and coefficient of variance (CV; CV = SD/mean) were calculated for each photograph to evaluate variance between observers. Analysis of variance was performed by Kruskal-Wallis one-way analysis of variance (ANOVA) on ranks (SigmaStat version 3.5, Systat Software, Inc. Chicago, IL). Values of p less than 0.05 were considered significant.
3. Results
3.1. Validation of scar height and color mismatch scoring
The ICC between scored and actual scar height was 0.81 (Supplementary Fig. 3). Testing of color mismatch scoring revealed that the ICC between digital photograph software and the observers’ ratings was 0.83 for L*a*b* and 0.87 for RGB (Supplementary Fig. 4a, b). The ICC between spectrophotometry (actual color) and the observers’ ratings was comparable, at 0.84 (Supplementary Fig. 5). The power of these tests was 1 (alpha, 0.05).
3.2. Reliability and variance between observers in the original and modified scales
The ICC was higher in the modified scale (0.90) than in the original scale (0.83). The modified scale also had a higher Po (modified, 0.24 vs. original, 0.12) and Cronbach’s Alpha (modified, 0.91 vs. original, 0.84). On the other hand, the original scale had a higher variance (original, 0.35 ± 0.19 vs. modified, 0.15 ± 0.06) and CV (original, 7.54 ± 6.73 vs. modified, 1.47 ± 1.21) (Fig. 5). Further analysis of the categories in each scale revealed that all categories of the modified scale had a higher correlation and reliability than those of the original scale (Tables 2 and 3). In addition, the variance and CV were consistently higher in the original scale than in the modified scale for all categories (Figs. 6 and 7). Finally, an analysis of variance between the observers detected no statistical difference between the observers in the modified scale. However, in the original scale, differences were detected in 6 of the 10 possible pairs of observers (p < 0.05).
Fig. 5.
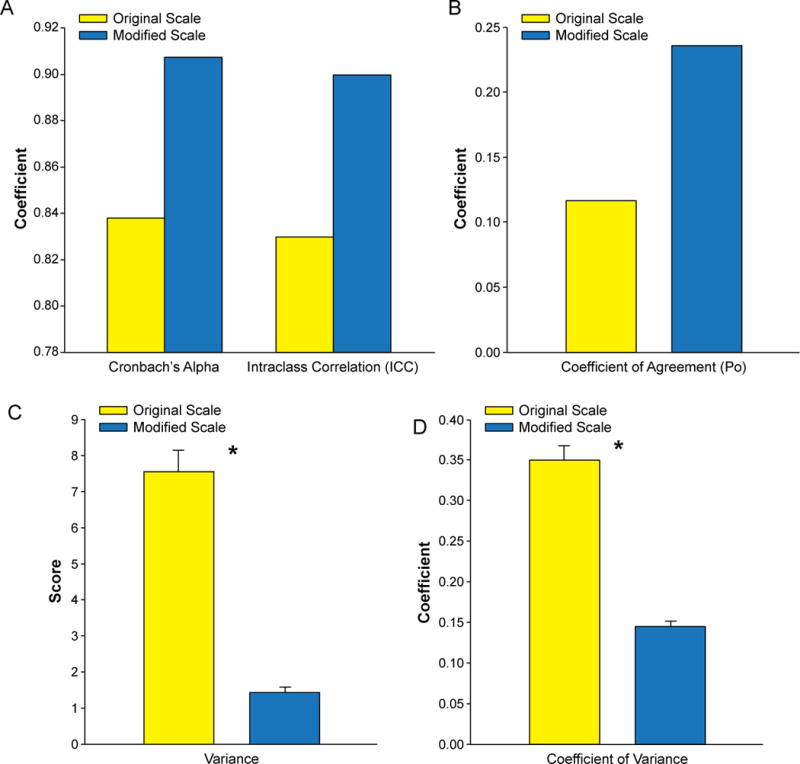
Comparison of correlation and variance in final scores of the original and modified scales. A) Coefficients of correlation. B) Po. C) Variance. *p < 0.05. D) CV. *p < 0.05.
Table 2.
Original Scale: Correlation and Variance by Category.
| Statistical Parameter | Category
|
|||
|---|---|---|---|---|
| Surface | Height | Color | Thickness | |
| Cronbach’s Alpha | 0.74 | 0.83 | 0.75 | 0.77 |
| Intraclass Correlation1 (95% Confidence Interval) | 0.32 (0.24 – 0.42) | 0.47 (0.48 – 0.57) | 0.36 (0.28 – 0.46) | 0.39 (0.30 – 0.48) |
| Po | 0.33 | 0.39 | 0.26 | 0.35 |
| CV ± SEM | 0.67 ± 0.94 | 0.45 ± 0.31 | NC2 | 0.41 ± 0.21 |
| Variance ± SEM | 1.40 ± 1.28 | 0.63 ± 0.50 | 0.66 ± 0.44 | 1.37 ± 1.07 |
Based on standardized items.
NC: Resulted in error (mean = 0).
Table 3.
Modified Scale: Correlation and Variance by Category.
| Statistical Parameter | Category
|
||
|---|---|---|---|
| Surface Appearance | Height | Color | |
| Cronbach’s Alpha | 0.88 | 0.87 | 0.82 |
| Intraclass Correlation1 (95% Confidence Interval) | 0.59 (0.52 – 0.67) | 0.56 (0.48 – 0.64) | 0.46 (0.38 – 0.57) |
| Po | 0.52 | 0.54 | 0.43 |
| CV ± SEM | 0.19 ± 0.11 | 0.20 ± 0.12 | 0.24 ± 0.10 |
| Variance ± SEM | 0.32 ± 0.26 | 0.30 ± 0.24 | 0.41 ± 0.26 |
Based on standardized items.
Fig. 6.
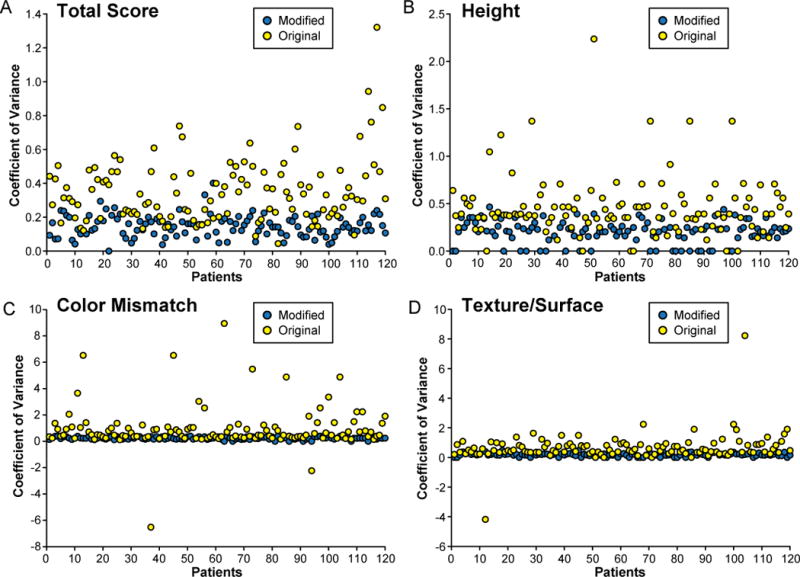
Comparison of the CV for each individual photograph in the original and modified scoring systems. A) Total score. B) Height. C) Color mismatch. D) Surface appearance (modified scale)/surface (original scale).
Fig. 7.
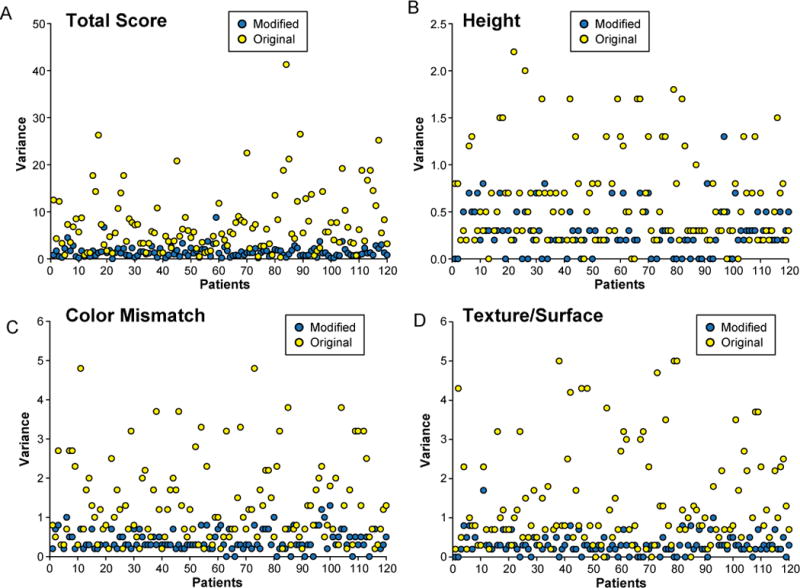
Comparison of variance for each individual photograph in the original and modified scoring systems. A) Total score. B) Height. C) Color mismatch. D) Surface appearance (modified scale)/surface (original scale).
4. Discussion
No scale currently exists for the analysis of scars from photographs of burn patients. However, patient photographs have been used to assess the reliability of some scales, providing some information on the reliability of picture analysis. In a study by Smith et al. [14], 95 varied observers (clinicians, secretaries, and support staff) scored 30 pictures of patients. Smith and coworkers conducted an interesting analysis to determine whether differences in gender, profession, or experience with burn patients influenced the reliability of scores. The only variable that achieved a good reliability score (> 0.7) among all observers was overall disfigurement (clothed). Irregularity, thickness, and discoloration did not achieve this level of reliability in the evaluation. A high reliability (> 0.8) could be obtained with any 8 raters randomly selected from the pool of 95 observers, though this was achieved using the Spearman-Brown formula. Unfortunately, this formula can only be used when the half-tests are classically parallel (the true scores and error variances for the halves should be equal for every population of examinees taking the half tests) [15]. Crowe et al. [7] scored ten sets of four pictures (different time points) of each patient. Once the pictures of one patient were scored, the set of pictures of the next patient were scored. The observers were aware of this picture arrangement, which could have biased the scoring. The observers consisted of two novices and two experts. However, the ICC was calculated according to expertise, and the authors did not describe the ICC of the four observers together. Beasusang et al. [9] analyzed image (photograph) scoring as well as clinical and histological scar assessment. For the image analysis, ten observers first assessed 22 photographs and then assessed 14 photographs for test-retest analysis. The photograph scoring was not compared with clinical and histological analysis. The overall reliability of image scoring, as judged by the Spearman’s correlation coefficient, was 0.87.
Among all scar scales, that described by Yeong et al. [8] has yielded the highest reliability (ICC of 0.94 for scar surface, 0.95 for border height, 0.90 for thickness, and 0.85 for color differences). For this reason, we chose to base our scale on this scheme. Our scale consisted of three modified versions of characteristics from Yeong and colleagues’ scale. Of these, the color mismatch category was used to account for differences in pigmentation (hypo and hyperpigmentation) and the presence of erythema. One of the main problems with some scoring systems is that they assign a specific color (e.g., red, purple) to scars, resulting in high variability. Our color mismatch scoring system avoided this pitfall and required that scores for differences in pigmentation and erythema be combined. We believe that use of three categories keeps the scoring simple and reliable, but is sufficient to allow one to discriminate between varying degrees of maturation (erythema) and to monitor outcomes of therapy aimed at rectifying hypo and hyperpigmentation. One difficulty in assessing color differences is the diversity of possible skin tones, even within an individual patient. Thus, assessing color mismatch is most appropriately done by comparing the scar with adjacent (or the closest) non-affected skin. Including non-affected skin in the photograph or zooming out to include a larger area (even a picture of the entire patient, if necessary) is essential to adequately evaluate the appearance of the patient’s normal skin (Fig. 1). This is particularly useful when the scored scar exhibits mixed hypo and hyperpigmentation areas. Assessing color differences between scars and normal skin is also difficult due to the numerous variables involved in the perception of color. These include, but are not limited to, photographic settings (e.g., camera resolution and source of light) and individual perception. Nevertheless, we have demonstrated that color differences between scarred and normal skin can be reliably assessed in photographs of burn patients, with a correlation of 0.83.
The second characteristic in our scale was surface appearance, which is related to the cosmetic appearance of the scar. The presence of smooth skin is non-natural and should be differentiated from normal skin. However, because this distinction is subtle and the scar may have an appearance close to that of normal skin, we decided to score it as 2 instead of −1, as in the original scale. For variables without true values, such as scar surface evaluation, validation requires assessment of reliability and the correlation between observers to demonstrate a score’s utility. This was the case with assessment of the cosmetic appearance of the scar surface, which had the highest correlation among observers (Table 3).
The final characteristic in our scale was scar height, which is usually intended to assess hypertrophy. The only way to accurately assess hypertrophy (scar height) is to objectively measure the elevation from the normal skin plane. However, we found that when a description of the characteristics of the scar border was provided, the scale proved to be highly reliable in assessing border height. The intention of the score was not to provide a specific height (or depression) of the scar in millimeters. Indeed, this would be impossible to determine in a photograph. Instead, our goal was to demonstrate that different levels of depression and elevation of the scar could be reliably scored. Given this goal, the standardization of photography is mandatory. Scar depression can be subtle or prominent and was included in the height category as varying degrees of negative slope (drop of the border). Our goal is to allow analysis of different clinical scenarios (e.g., reepithelialization, tangential and fascial excision, treatments oriented to decrease hypertrophic scarring).
The utility of the modified scale was determined by analyzing reliability, which indicates the quality of the measurements [16]. Several methods can be used to evaluate the reliability. Each provides specific information and has pros and cons. We decided to apply more than one to obtain a comprehensive evaluation of this scoring system. Correlation has limitations in testing reliability because it does not allow for the assessment of more than two observers [12]. Furthermore, correlation does not provide a measure of reliability, only covariance [12]. Therefore, we analyzed the scores of the ten possible pairs of observers (all raters pair-wise) to test Po and correlations. The ICC reflects both degrees of correspondence and agreement among two or more ratings. Consequently, ICC is an extension of the reliability coefficient [12]. A value of 1 reflects perfect agreement (no variance), while 0 reflects perfect disagreement. Both the original and modified scales resulted in a good ICC, but the modified scale was closer to 1 than the original scale. Yeong et al. [8] reported an ICC of 0.95 for scar surface, 0.93 for scar thickness, 0.95 for scar border height, and 0.85 for color difference from normal. We were unable to reproduce these values in our study, perhaps due to the larger sample size of this study (120 photographs in this study vs. 10 in the Yeong study). For a significance level of 0.95 and a confidence-interval width of 0.2, the sample size necessary to generate the ICCs calculated for the original-scale categories (ICC = 0.32 – 0.47) was 87 – 94 samples and that necessary to generate the ICCs of the modified-scale categories (ICC = 0.46 – 0.59) was 71 – 84 samples [17]. For the final scores, the required sample size for the modified scale was 10 samples (ICC = 0.9) and for the original scale was 28 samples (ICC = 0.83). Unfortunately, Yeong et al. [8] did not report the ICC for the final score.
Kappa statistics is a chance-corrected analysis of exact agreement between scores. It provides a general idea of agreement. However, it does not provide a measure for “close agreement” and gives no value to scores that remain close over several events [13], making it inadequate for assessing a scar scale score. We decided to analyze CV to determine how close or different the values between observers were using both scales. Due to the fact that the original scale included negative numbers, the scores were equal to zero in some cases. This made it impossible to calculate the CV. The presence of negative numbers also consistently affected the CV. Therefore, we analyzed variance using Kruskal-Wallis one-way ANOVA by ranks, as previously described. Repeated measures of ANOVA is needed for assessing the variance between scores (raters) in this model [12]. Both analyses detected significant differences among observers for the original scale, and the variance in scores was significantly higher for the original scale than for the modified scale. No significant difference between observers was detected for the modified scale.
In summary, this modified scar scale score can be used to evaluate photographs of severely burned patients to assess the severity of post-burn scarring, either prospectively or retrospectively. Use this method requires standard photographic conditions and a standard comparison chart (Fig. 3). By adhering to these guidelines, investigators can reliably evaluate hypertrophic scarring progression over time. We have used one of the largest sample sizes of scored photographs (compared to studies in the literature) and comprehensive statistical analysis to show that this new, modified scale is valid and reliable. It is important to note that comparison of this new scoring system with other clinic-based scoring systems (e.g., the Vancouver scar scale) is not feasible, since some parameters like pliability are impossible to assess in photographs. Ultimately, these clinic-based scoring systems were not designed for photograph analysis. Our newly described modifications provide a useful tool to investigators interested in assessing hypertrophic scarring.
Supplementary Material
Acknowledgments
The authors thank Dr. Kasie Cole for editing and proofreading this manuscript.
Sources of funding: This study was supported by grants from Shriners Hospitals for Children (80100, 80480, 71008, 8660, 8740, 71001, 8760, and 9145), National Institutes of Health (R01-GM56687, R01-GM56687-11S1, R01-GM087285, T32-GM008256, and P50-GM60338), the National Institute on Disability and Rehabilitation Research (H133A020102), The Canadian Institutes of Health Research (#123336), the CFI Leader’s Opportunity Fund (#25407), the Physicians Services Incorporated Foundation—Health Research Grant Program, and the Wound Healing Foundation. CCF is an ITS Career Development Scholar supported, in part, by NIH KL2RR029875 and NIH UL1RR029876. This work was also supported in part by a Clinical and Translational Science Award from NCATS (UL1TR000071).
Footnotes
Publisher's Disclaimer: This is a PDF file of an unedited manuscript that has been accepted for publication. As a service to our customers we are providing this early version of the manuscript. The manuscript will undergo copyediting, typesetting, and review of the resulting proof before it is published in its final citable form. Please note that during the production process errors may be discovered which could affect the content, and all legal disclaimers that apply to the journal pertain.
All authors made substantial contributions to the conception or design of the work (CCF, DNH, LKB, RK, SAM, HGR, NR, MGJ); or to the acquisition, analysis, or interpretation of data for the work (GAM, AMA, SH, FNW, SAM, HGR, NR); and the drafting the work or revising it critically for important intellectual content (All authors).
Disclosures: None declared
References
- 1.Desai MH, Herndon DN, Broemeling L, Barrow RE, Nichols RJ, Jr, et al. Early burn wound excision significantly reduces blood loss. Ann Surg. 1990;211:753. doi: 10.1097/00000658-199006000-00015. [DOI] [PMC free article] [PubMed] [Google Scholar]
- 2.Herndon DN, Barrow RE, Rutan RL, Rutan TC, Desai MH, et al. A comparison of conservative versus early excision. Therapies in severely burned patients. Ann Surg. 1989;209:547. doi: 10.1097/00000658-198905000-00006. [DOI] [PMC free article] [PubMed] [Google Scholar]
- 3.Oliveira GV, Chinkes D, Mitchell C, Oliveras G, Hawkins HK, et al. Objective assessment of burn scar vascularity, erythema, pliability, thickness, and planimetry. Dermatol Surg. 2005;31:48. doi: 10.1111/j.1524-4725.2005.31004. [DOI] [PubMed] [Google Scholar]
- 4.Lau JC, Li-Tsang CW, Zheng YP. Application of tissue ultrasound palpation system (TUPS) in objective scar evaluation. Burns. 2005;31:445. doi: 10.1016/j.burns.2004.07.016. [DOI] [PubMed] [Google Scholar]
- 5.Katz SM, Frank DH, Leopold GR, Wachtel TL. Objective measurement of hypertrophic burn scar: a preliminary study of tonometry and ultrasonography. Ann Plast Surg. 1985;14:121. doi: 10.1097/00000637-198502000-00005. [DOI] [PubMed] [Google Scholar]
- 6.Sullivan T, Smith J, Kermode J, McIver E, Courtemanche DJ. Rating the burn scar. J Burn Care Rehabil. 1990;11:256. doi: 10.1097/00004630-199005000-00014. [DOI] [PubMed] [Google Scholar]
- 7.Crowe JM, Simpson K, Johnson W, Allen J. Reliability of photographic analysis in determining change in scar appearance. J Burn Care Rehabil. 1998;19:183. doi: 10.1097/00004630-199803000-00019. [DOI] [PubMed] [Google Scholar]
- 8.Yeong EK, Mann R, Engrav LH, Goldberg M, Cain V, et al. Improved burn scar assessment with use of a new scar-rating scale. J Burn Care Rehabil. 1997;18:352. doi: 10.1097/00004630-199707000-00014. [DOI] [PubMed] [Google Scholar]
- 9.Beausang E, Floyd H, Dunn KW, Orton CI, Ferguson MW. A new quantitative scale for clinical scar assessment. Plast Reconstr Surg. 1998;102:1954. doi: 10.1097/00006534-199811000-00022. [DOI] [PubMed] [Google Scholar]
- 10.Micomonaco DC, Fung K, Mount G, Franklin J, Yoo J, et al. Development of a new visual analogue scale for the assessment of area scars. J Otolaryngol Head Neck Surg. 2009;38:77. [PubMed] [Google Scholar]
- 11.Masters M, McMahon M, Svens B. Reliability testing of a new scar assessment tool, Matching Assessment of Scars and Photographs (MAPS) J Burn Care Rehabil. 2005;26:273. [PubMed] [Google Scholar]
- 12.Portney LG, Watkins MP. Foundations of clinical research: applications to practice. Upper Saddle River, N.J: Pearson/Prentice Hall; 2009. [Google Scholar]
- 13.Shrout PE, Fleiss JL. Intraclass correlations: uses in assessing rater reliability. Psychol Bull. 1979;86:420. doi: 10.1037//0033-2909.86.2.420. [DOI] [PubMed] [Google Scholar]
- 14.Smith GM, Tompkins DM, Bigelow ME, Antoon AY. Burn-induced cosmetic disfigurement: can it be measured reliably? J Burn Care Rehabil. 1988;9:371. doi: 10.1097/00004630-198807000-00011. [DOI] [PubMed] [Google Scholar]
- 15.Charter RA. It is time to bury the Spearman-Brown “Prophecy” Formula for some common applications. Educational and Psychological Measurement. 2001;61:690. [Google Scholar]
- 16.Trochim WM Research Methods Knowledge Base. Ohio: Atomic Dog Publishing; 2006. [Google Scholar]
- 17.Bonett DG. Sample size requirements for estimating intraclass correlations with desired precision. Stat Med. 2002;21:1331. doi: 10.1002/sim.1108. [DOI] [PubMed] [Google Scholar]
Associated Data
This section collects any data citations, data availability statements, or supplementary materials included in this article.


