Figure 5.
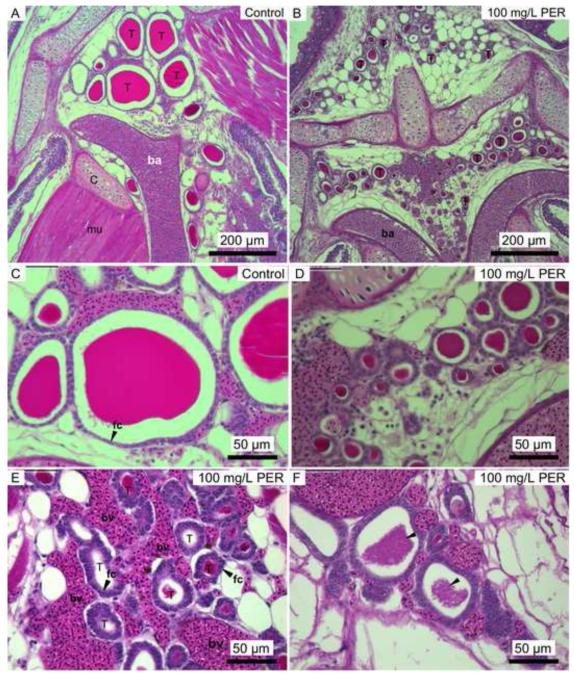
Photomicrographs of threespine stickleback thyroid tissue from control water (A & C) and 100 mg/L perchlorate exposures (B, D, E & F). T = thyroid follicle, ba = branchial artery, bv = blood vessels, fc = follicular cell. Some perchlorate-exposed fish exhibited thyrocyte (fc) hypertrophy (arrows in E) compared to control thyrocytes (arrow in C) and grainy colloid (arrows in F). Note the proliferation of small follicles in exposed fish (B) compared to control fish (A).

