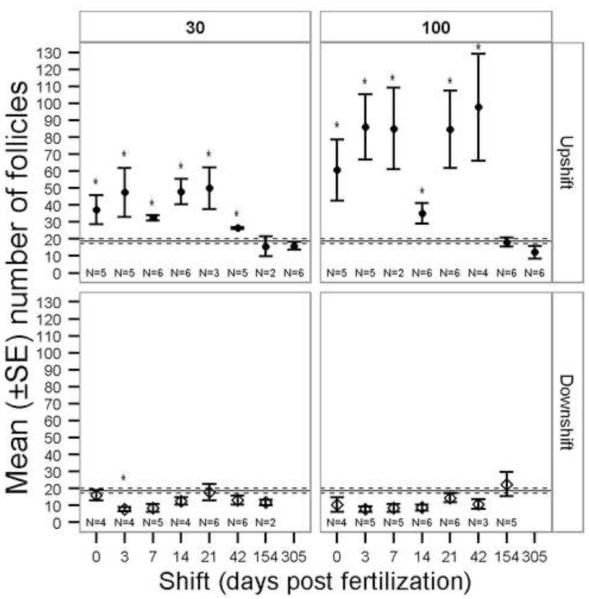
Figure 6.
Mean (±SE) number of thyroid follicles in slides from perchlorate-exposed threespine stickleback. 30 = 30 mg/L perchlorate, 100 = 100 mg/L perchlorate. Exposure regime: Downshift = fish began in contaminated water and were moved to untreated water on the given day post fertilization (dpf), Upshift = fish began in untreated water and were moved to contaminated water on the given dpf. The Kruskal-Wallis test was used to compare treatments within each panel (concentration and exposure regime). The solid horizontal line is the control group mean and dashed lines are the SE of the control group. Asterisks indicate a significant difference from control (α = 0.05). Note that the x axis is not a linear scale.

