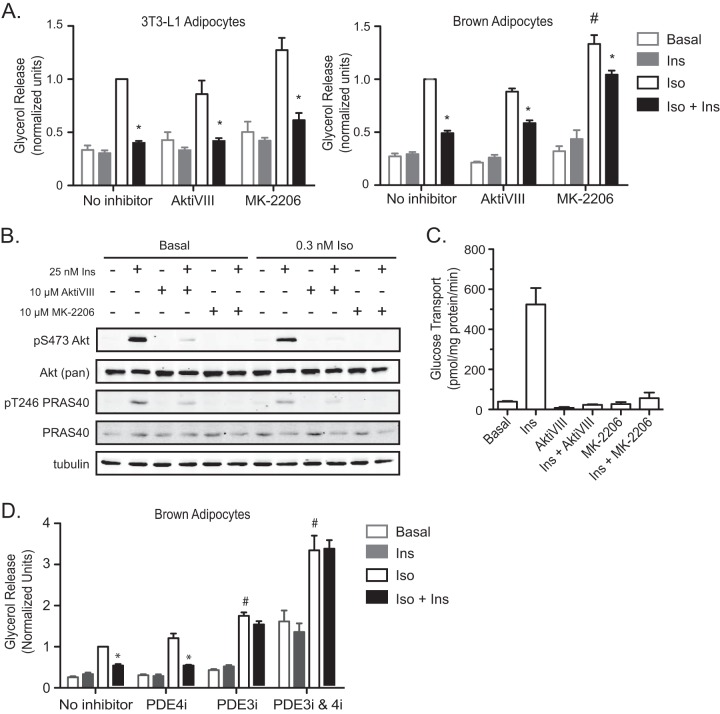
FIG 1.
Insulin suppresses glycerol release in both 3T3-L1 and brown adipocytes independently of Akt activity. (A) Glycerol release was measured at the basal state and upon stimulation with 0.3 nM isoproterenol (Iso) in the presence or absence of 25 nM insulin (Ins), 10 μM AktiVIII, or 10 μM MK-2206 for 1 h in both 3T3-L1 and brown adipocytes. Data from 3T3-L1 (n = 3) and brown adipocytes (n = 6) were normalized to those with Iso alone. Symbols indicate significant differences (P < 0.05) for insulin suppression (*) and for Iso alone versus Iso plus MK-2206 (#). (B) Cell lysates from the experiment for which results are shown in panel A were assessed for Akt phosphorylation by Western blotting. (C) The uptake of 2-deoxyglucose into brown adipocytes was measured upon stimulation with 100 nM insulin in the presence or absence of AktiVIII or MK-2206 at the same concentrations used in the experiment for which results are shown in panel A. Values represent the results of 3 experiments. (D) Glycerol release from WT brown adipocytes upon stimulation with 0.3 nM Iso in the presence or absence of 25 nM insulin, 10 μM rolipram (PDE4i), 10 μM cilostamide (PDE3i), or a combination of PDE3i and PDE4i. Data were normalized to those for Iso with no inhibitor. Values represent the results of 3 to 7 experiments. Symbols indicate significant differences (P < 0.05) for insulin suppression (*) and between Iso with a PDE inhibitor and Iso alone (#). All data are presented as means ± standard errors of the means. Statistical analysis was performed using one-way ANOVA and Tukey's posttest.

