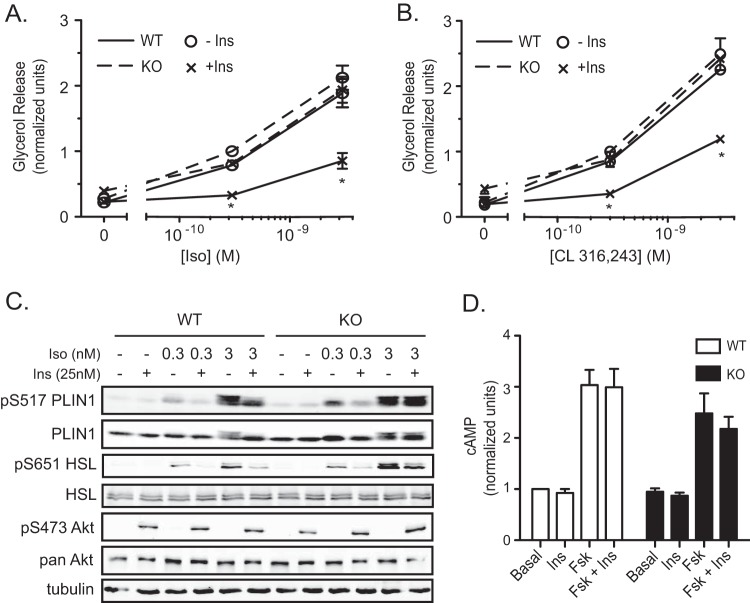
FIG 3.
Pde3b-KO brown adipocytes have impaired insulin-mediated suppression of lipolysis. (A and B) Glycerol release from WT (solid lines) and Pde3b-KO (dashed lines) brown adipocytes without stimulation or upon stimulation with 0.3 nM or 3 nM isoproterenol (Iso) (A) or CL 316,243 (B) in the presence (×) or absence (○) of 25 nM insulin. Data were normalized to a 0.3 nM dose in Pde3b-KO adipocytes. Values represent results for 3 to 7 experiments. Asterisks indicate significant differences (P < 0.05) for insulin suppression in WT cells. (C) Representative immunoblots for tubulin and phosphorylated and total perilipin 1 (PLIN1), HSL, and Akt in whole-cell lysates harvested at the termination of glycerol release assays. (D) Intracellular cAMP measurement in WT and Pde3b-KO adipocytes upon stimulation with 1 μM forskolin (Fsk) with or without the addition of 25 nM insulin. Data were normalized to basal values of WT cells. Values represent results for 5 experiments. All data are presented as means ± standard errors of the means. Statistical analysis was performed using one-way ANOVA with Tukey's posttest.

