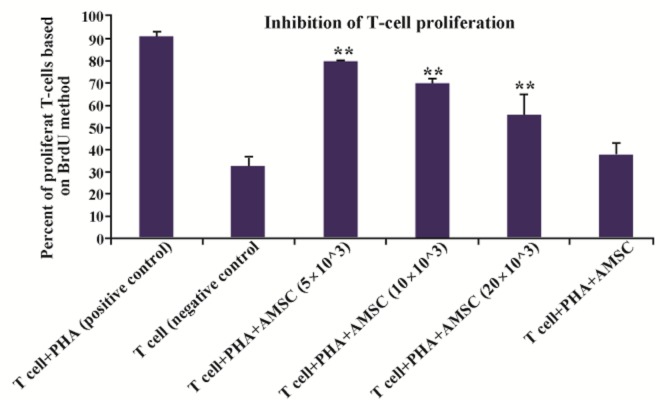
Figure 3.

The inhibitory effects of hAM-MSCs on the proliferation of T cells. T cells (1×10 6 ) were co-cultured with different densities of irradiated hAM-MSCs in the presence or absence of PHA in the final volume of 250 μl for 72 hr. Each bar was compared with the T cell+PHA (control T cells) group. Data were presented as the mean ±SD of four independent experiments **p≤0.01.
