Figure 3.
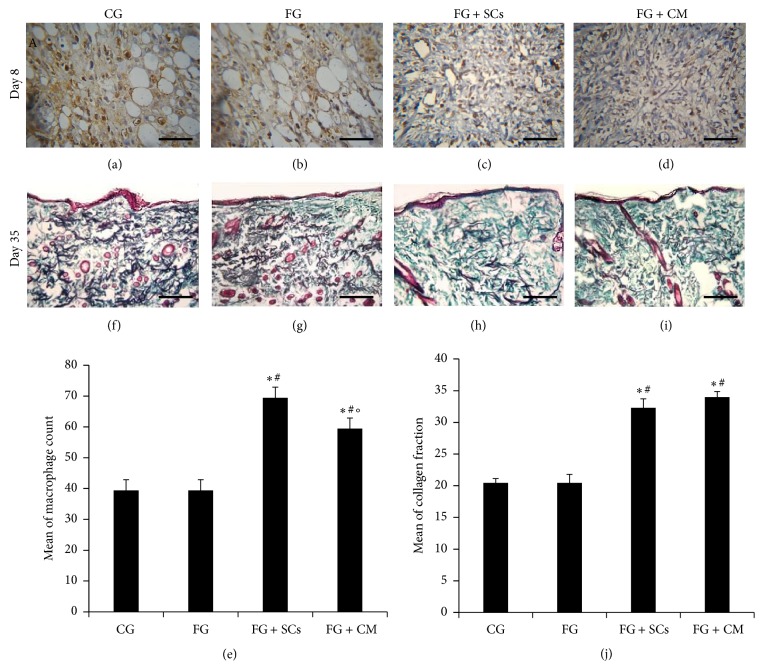
(a)–(d) Immunohistochemistry of granulation tissue 8 days after injury showing variable degrees of immunoreactivity in CD68+ macrophages (brown color). Each figure is a hematoxylin-counterstained representative section (Scale bar = 50 µm). (e) Macrophage count/HPF. (f)–(i) Photomicrographs of skin biopsies 35 days after injury depicting variable amounts and arrangement of collagen fibers in the dermis. Each figure is a Masson's trichrome-stained representative section (scale bar = 200 µm). (j) Histomorphometric quantification of mean collagen fraction. In (e) and (j) F-test (ANOVA) test was used to analyze data presented as mean ± SD; “∗” is significant versus CG and “#” is significant versus FG group [p < 0.001], while “°” is significant versus FG + CM [p < 0.05] (n = 3).

