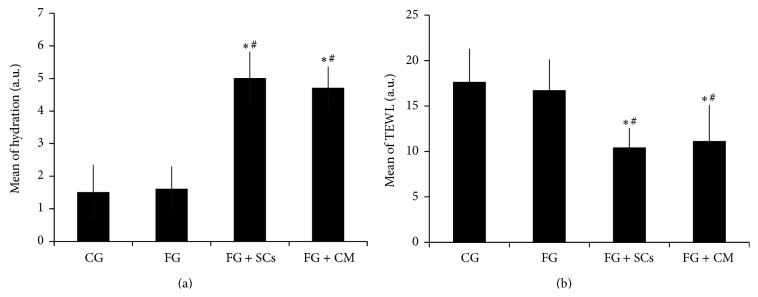
Figure 4.

Comparison between the different studied groups according to hydration (a) and TEWL (b). One-way ANOVA test was used to analyze the data presented as mean ± SD; “∗” is significant versus CG; “#” is significant versus FG group [p < 0.001] (n = 7).
