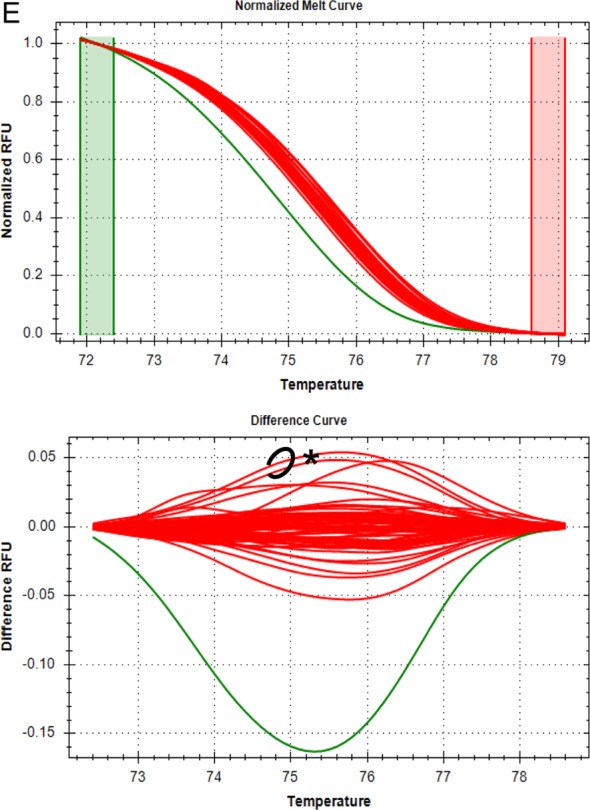
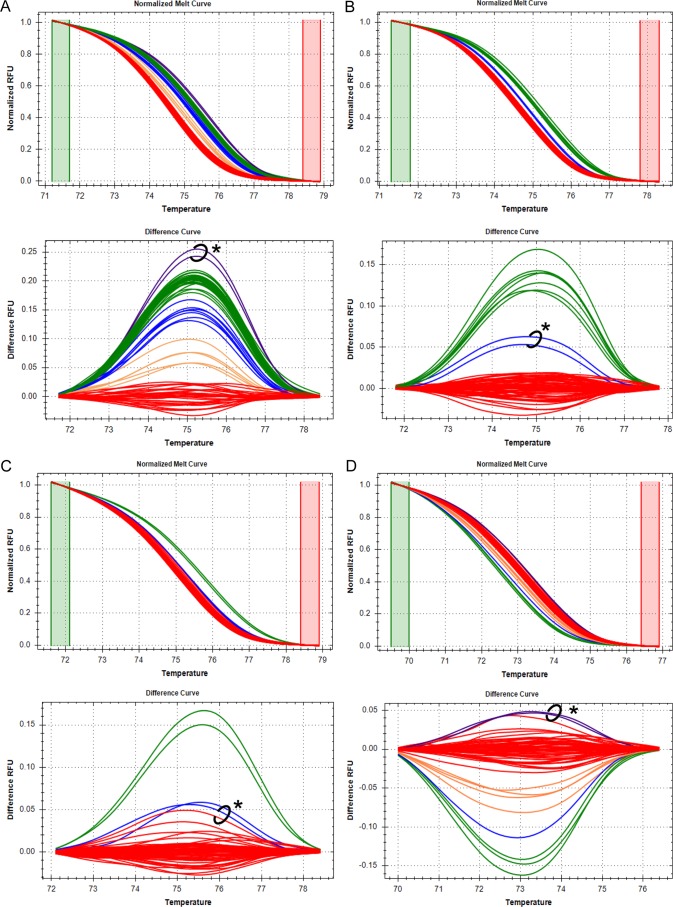
FIG 1.

Identification of C. felis cytb1 by HRM analysis of five cytb nucleotides. High-resolution melt curves and differential fluorescence curves of 69 samples are shown for one of three replicate PCRs for each of the five nucleotide positions analyzed. Green and red boxes on melt curves indicate the pre- and postmelt regions, respectively, used for data normalization. RFU, relative fluorescence units. Red clusters of melt curves represent samples with the nucleotide sequence for cytb1 at each position, while clusters of other colors represent samples with SNPs at that location. Two samples (circled on difference curves and denoted with an asterisk) had anomalous clustering patterns that occurred for all nucleotides analyzed in at least one replicate PCR. The clustering patterns of those two samples could not be explained by chromatographic data but did not affect the sensitivity or specificity of the overall assay. (A) Nucleotide position 750. The red cluster represents samples with adenine at nucleotide 750, while the green cluster represents samples with guanine at nucleotide 750. The blue and orange clusters represent samples with apparent heteroplasmy. Based on chromatographic data, the circled samples (purple cluster) had a guanine at nucleotide 750 but clustered outside the expected spectrum of results. (B) Nucleotide position 947. The red cluster represents samples with thymine at nucleotide 947, while the green cluster represents samples with cytosine at nucleotide 947. Based on chromatographic data, the circled samples (blue cluster) had a thymine at nucleotide 947 but clustered between the clusters for thymine and cytosine. (C) Nucleotide position 399. The red cluster represents samples with adenine at nucleotide 399, while the green cluster represents samples with guanine at nucleotide 399. The blue cluster represents samples with apparent heteroplasmy. Based on chromatographic data, the circled samples had an adenine at nucleotide 399 but clustered with a sample confirmed to have heteroplasmy at nucleotide 399 (for replicate PCR data shown, only one sample demonstrated this clustering). (D) Nucleotide position 274. The red cluster represents samples with cytosine at nucleotide 274, while the green cluster represents samples with thymine at nucleotide 274. The blue and orange clusters represent samples with apparent heteroplasmy. Based on chromatographic data, the circled samples (purple cluster) had a cytosine at nucleotide 274 but clustered outside the expected spectrum of results. (E) Nucleotide position 858. The red cluster represents samples with guanine at nucleotide 858, while the green cluster represents samples with an adenine at nucleotide 858. Based on chromatographic data, the circled samples had a guanine at nucleotide 858 but, in 1 of 3 PCR replicates, the samples clustered outside the expected spectrum of results (data from the PCR replicate shown do not have this clustering pattern).

