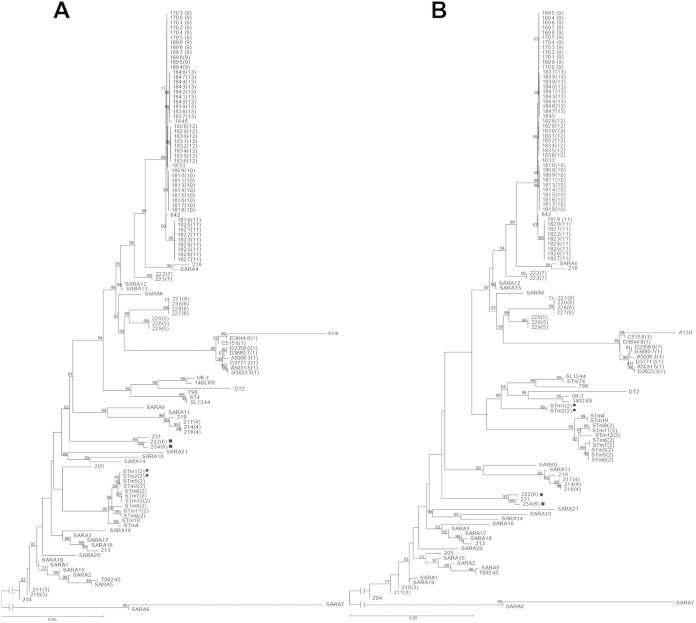
FIG 2.
Phylogenetic relationships of S. Typhimurium isolates based on S. Typhimurium core genes (A) and Salmonella core genes (B). The minimum evolution method was used to infer evolutionary relationships of the isolates. The numbers in brackets represent outbreak numbers. Bootstrap was performed with 1,000 replicates. The bootstrap values (1,000 replicates; >50%) are shown next to the branches. The unit of the scale bar indicates the evolutionary distance in substitutions per nucleotide. The solid circles and squares indicate the wrongly placed isolates from outbreaks 2 and 6, respectively, by SCG typing.

