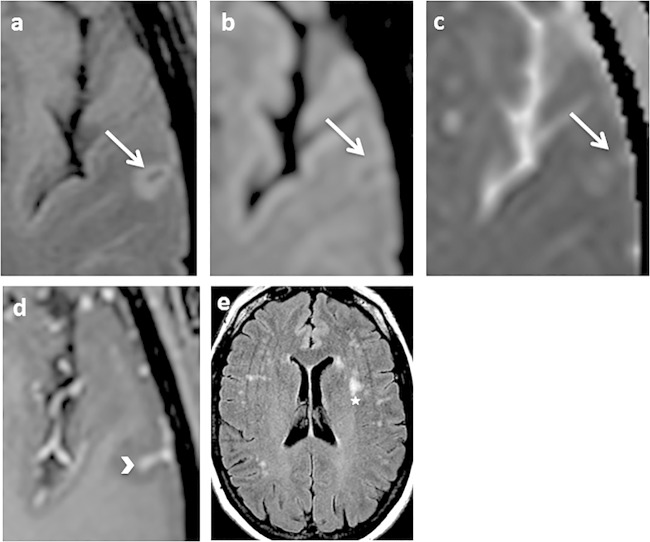
FIG 1.
Axial fluid attenuated inversion recovery (FLAIR) (a and e), axial diffusion (b), apparent diffusion coefficient map (c), and axial T1 spin echo (SE) after gadolinium injection (d). Shown are mild cortical FLAIR and diffusion hypersignal, with mild restriction of the diffusion coefficient in the left temporal lobe (arrow). An arrowhead shows leptomeningeal enhancement after gadolinium administration in the depth of the adjacent sulcus arrowhead. A star indicates white matter subcortical nonspecific hyperintensities.

