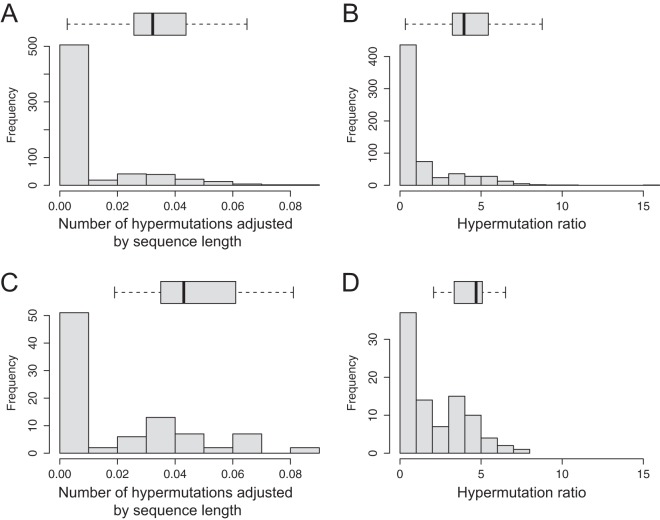
FIG 3.
Distributions of APOBEC-induced hypermutations in sequences amplified from proviral DNA (histograms). The horizontal box plots outline the distributions of APOBEC-induced hypermutations in subsets of sequences with identified drug resistance mutations. The box plots are drawn to the x-axis scale. The left and right box boundaries indicate lower and upper quartiles, the line within the box is the median, and the left and right whiskers indicate minimum and maximum values without outliers. (A and B) Amplicon 1 (n = 649), distribution of hypermutations adjusted by sequence length (A) and distribution of hypermutation ratio data (B) (see Materials and Methods). (C and D) Amplicon 2 (n = 90), distribution of hypermutations adjusted by sequence length (C) and distribution of hypermutation ratio data (D) (see Materials and Methods).

