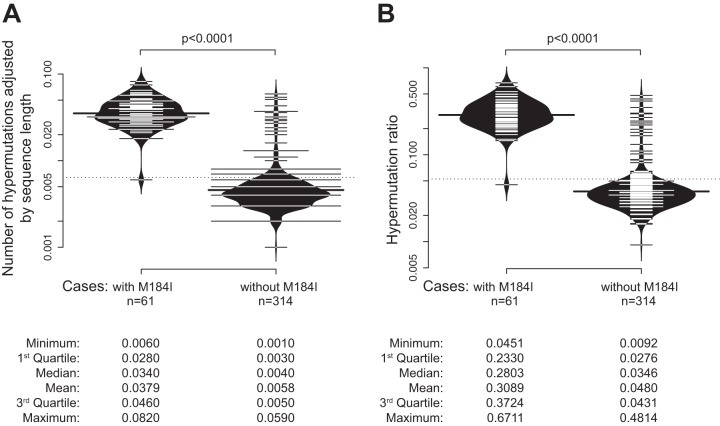
FIG 4.
G-to-A hypermutations in HIV-1C sequences with and without the M184I mutation. Bean plots (a combination of a box plot, a density plot, and a rug with ticks for each value in the middle) are shown (96). Comparison between groups was performed by a Wilcoxon signed-rank test. (A) Hypermutations adjusted by sequence length. (B) Hypermutation ratios. Summary statistics are presented at the bottom.

