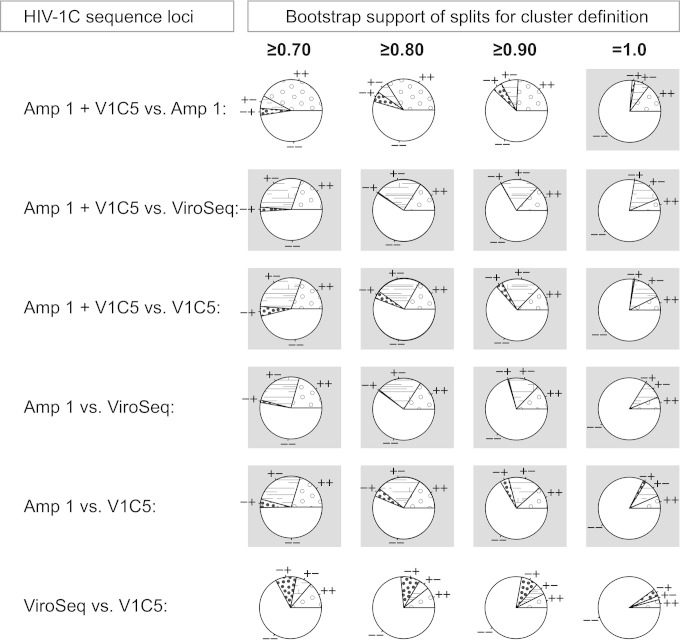
FIG 5.
Clustering of HIV-1C sequences by locus (n = 547). The proportions of HIV-1C sequences in clusters were estimated by bootstrapped ML inference. The extent of HIV clustering was analyzed at bootstrap thresholds for cluster definition of ≥0.70, ≥0.80, ≥0.90, and 1.0. The numbers of viral sequences found in clusters for a specified locus and at a specified bootstrap support were compared between loci. Four loci were used: amplicon 1 concatenated with the V1C5 region of gp120 (Amp 1 + V1c5), amplicon 1 alone (Amp 1), the ViroSeq sequence (ViroSeq), and the V1C5 region of gp120 (V1C5). The pie charts show concordant (++ and −−) and discordant (+− and −+) clustering between specified sequence loci (the first sign corresponds to the first sequence locus listed). Cases of significantly different clustering between loci with P values of less than 1.0E−04 in McNemar's test are highlighted with gray backgrounds.

