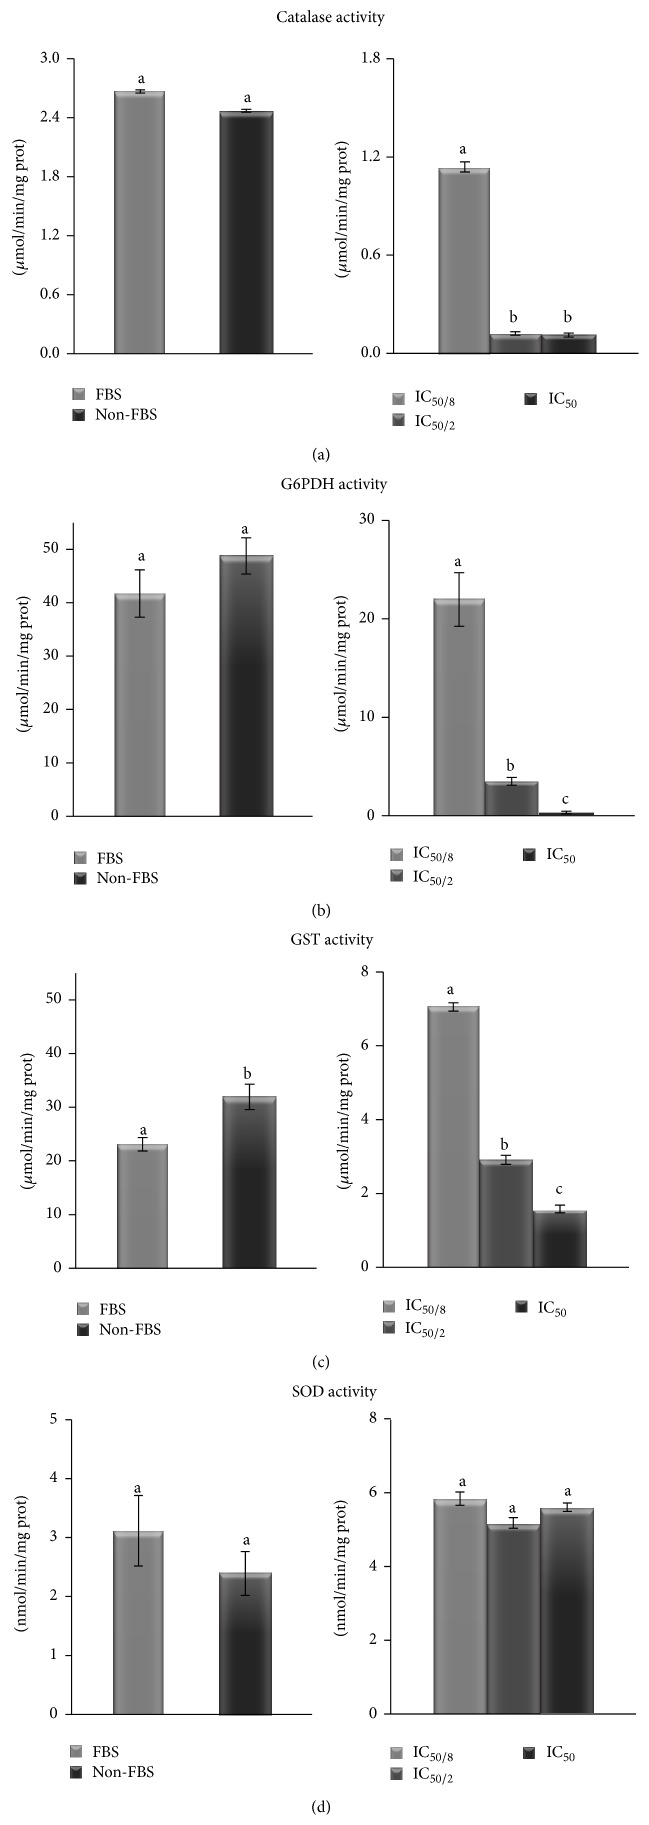
Figure 4.
CAT (a), G6PDH (b), GST (c), and SOD (d) specific activities on B16F10 cells. On the left side, cells cultivated with and without FBS, and on the right side, cell cultivated without FBS and different MA dosages. Values are expressed as means ± SD. Different letters indicate significant differences (P < 0.05).

