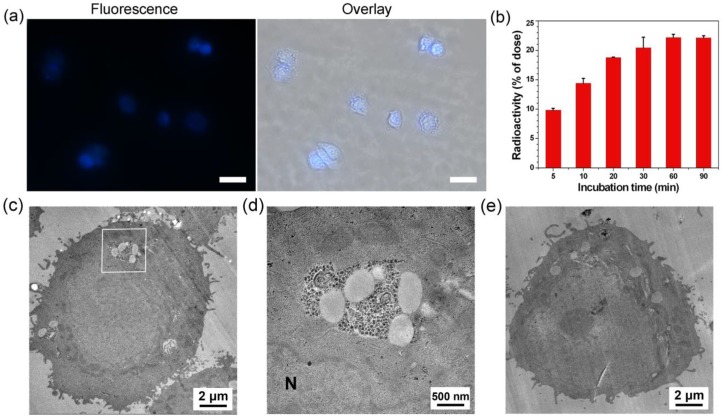
Figure 3.
(a) Left: Fluorescence image (DAPI channel) of MDA-MB-468 cells after incubation with 100 µM of 1-Cold at 37 °C for 0.5 h. Right: overlay of differential interference contrast (DIC) with fluorescence images. Scale bars: 20 µm. (b) Time course of cellular uptake of 1 on MDA-MB-468 cells. 600,000 cells were incubated with 1 µCi of 1. At each time point, cells were harvested to count the radioactivity using a γ-counter. (c) Electron microscopic image of MDA-MB-468 cells after incubation with 100 μM 1-Cold for 8 h. (d) High magnification electron microscopic image of the square area in c. Large area of clustered 1-Cold-NPs were found at/near Golgi bodies. N: nucleus. (e) Electron microscopic image of MDA-MB-468 cells.

