Fig 5.
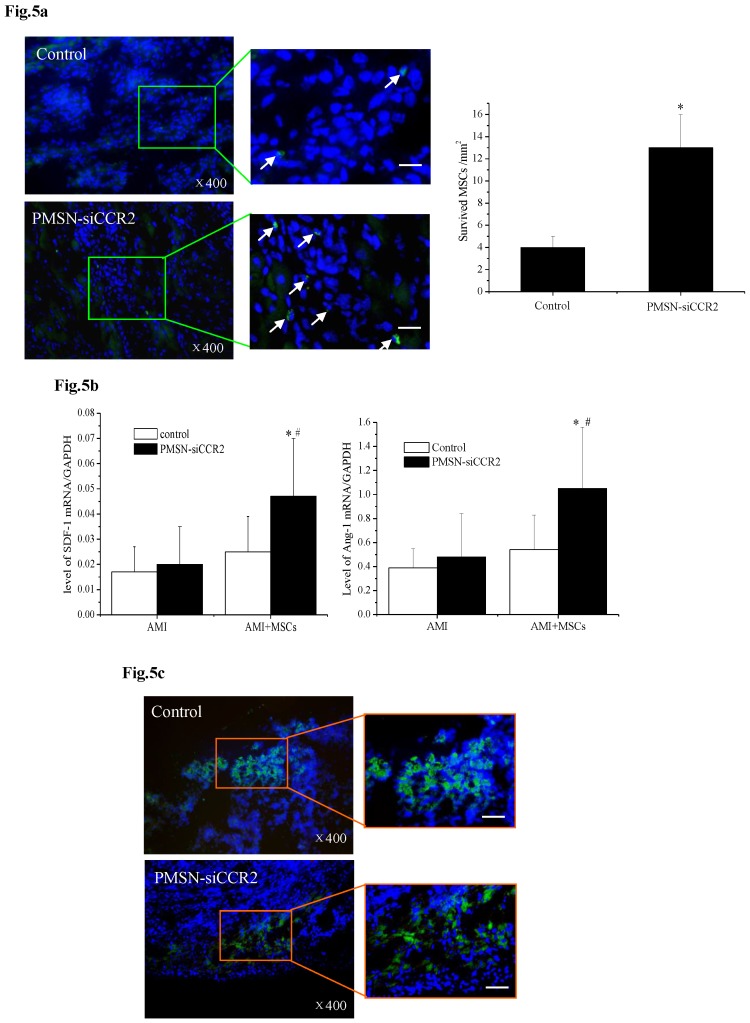
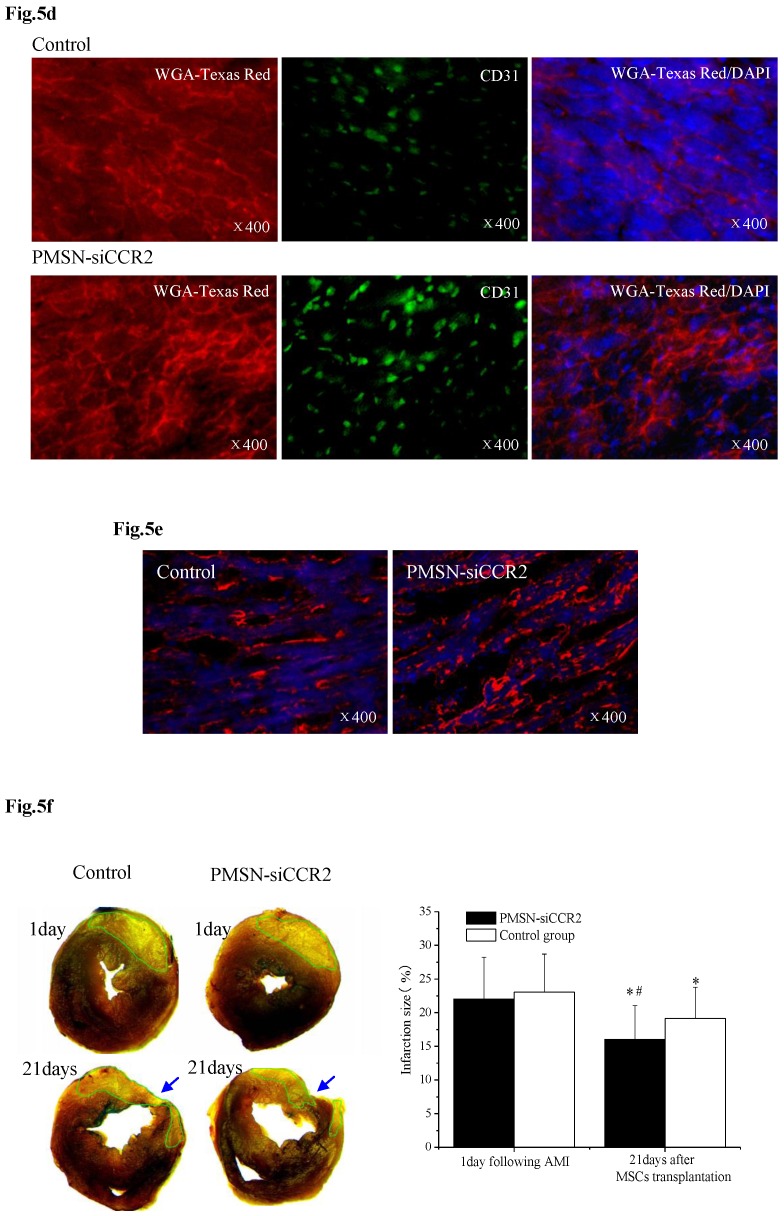
PMSNs-siCCR2-PEI enhanced the efficiency of MSC transplantation and attenuated myocardial remodeling (n=12). (a), The surviving MSCs in the infarct zone following cell therapy are shown by representative immunofluorescent staining for EdU (5-Ethynyl-2'-deoxyuridine, green) and visualization of the nuclei (DAPI, blue) within the infarct zone 3 days after cell transplantation. Scale bar=50 μm. (b), SDF-1 and Ang-1 mRNA levels in the infarct zone after MSC transplantation. The data represent the mean±SD, *p<0.05 vs. the corresponding group at 1 day post-AMI; #p<0.05 vs. the control group at 3 days after cell transplantation. (c), Representative image of immunofluorescent staining for TUNEL (Alexa Fluor 488, green) and DAPI in the infarct border zone 3 days after AMI; the number of TUNEL-positive cardiomyocytes was calculated. Scale bar=50 μm. (d), The vascular density was determined by immunofluorescent staining for wheat germ agglutinin (WGA, red), endothelial cells (staining of CD31, green) and DAPI (blue) in the infarct zone at 21 days after MSC transplantation. (e), Confocal image of representative immunofluorescent staining for cardiac myosin heavy chain (eFluor® 660, red) and DAPI (blue) staining of the nuclei within the infarct zone at 21 days after MSC transplantation. (f), Infarct size at baseline and at 21 days after MSC transplantation, Arrowheads (blue) indicate the diastolic thickness of the LV posterior walls (0.84±0.11 mm vs. 0.61±0.08 mm, p<0.001) over time in the two groups. *p<0.05 vs. the corresponding 1-day-post-AMI group; #p<0.05 vs. the control group at 21 days after cell transplantation.


