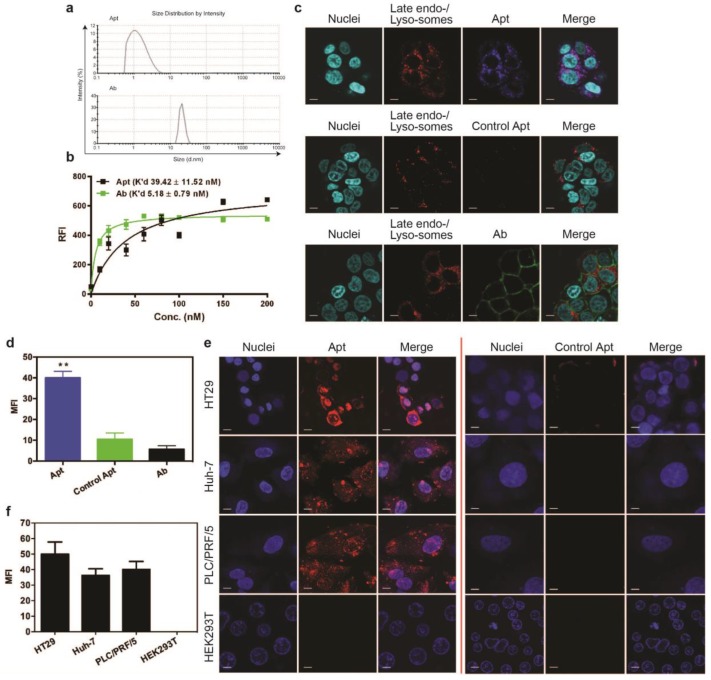
Figure 1.
Cell binding and internalization of EpCAM aptamer and antibody in vitro. (a) Particle size of EpCAM aptamer and EpCAM antibody as determined by dynamic light scattering. (b) Determination of the equilibrium dissociation constants (K'd) of EpCAM aptamer and EpCAM antibody to HT29 cells using flow cytometry by incubating cells at varying concentrations of aptamer and antibody (1-200 nmol/L). (c) Localization of EpCAM aptamer, control EpCAM aptamer or EpCAM antibody in acidic organelles (late endosome and lysosomes). Following incubation with 100 nM EpCAM aptamer or EpCAM antibody at 37 °C for 15 min and three time washes, HT29 cells were incubated with LysoTracker® Green in the first 90 min of a further 2 h incubation followed by confocal microscopy imaging. (d) Quantification of fluorescence signals from localized aptamer or antibody in acidic organelles (late endosome and lysosomes) as in (c). (e) Specificity of EpCAM aptamer binding and internalization. Three EpCAM-positive cell lines (HT29, Huh-7 and PLC/PRF/5) and the control EpCAM-negative HEK293T cells were incubated with 100 nM EpCAM aptamer or control EpCAM aptamer at 37 °C for 15 min, followed by washing and confocal microscopy imaging. (f) Quantification of fluorescence signals from internalized aptamers in various cell lines as in (e). Ab, antibody; Apt, aptamer, RFI, relative fluorescence intensity; MFI, mean fluorescence intensity. Data are means ± SEM, n=3. Scale bar = 5 μm.

