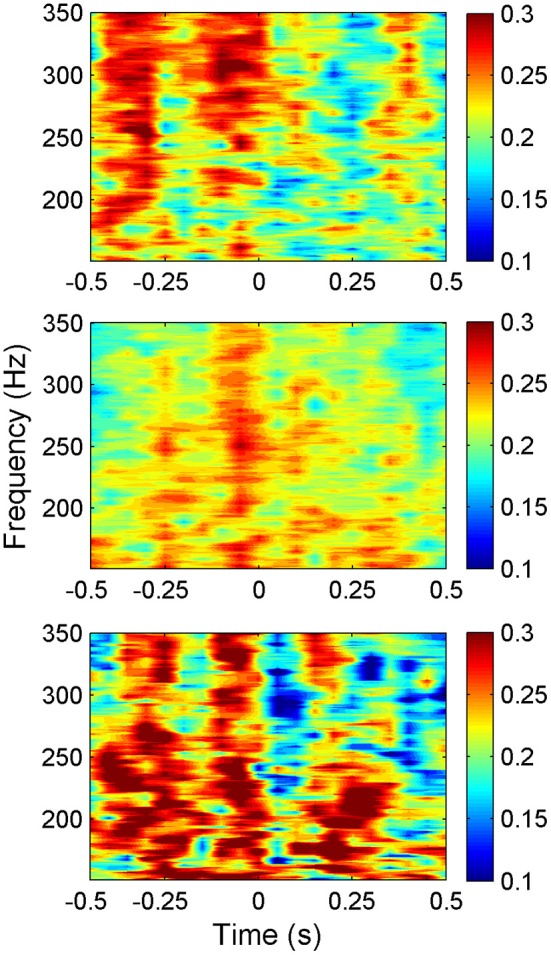
Figure 6.

Synchrony values plotted as a heat plot within the frequency band of interest (150–350 Hz) as a function of time for all three animals (N = 42, 23, and 18 trials top to bottom respectively) showing a consistent pattern of synchronization between animals around the time of lever press. The pattern shows an increase in synchronization just before the movement, then a sharp decrease at the initiation of the lever press (t = 0). Note that the alternating bands of high and low synchrony exist with or without behavior outside the time window shown.
