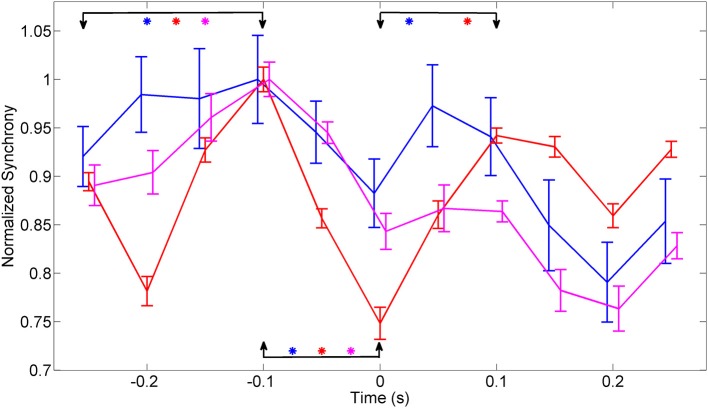
Figure 7.
Synchrony values were averaged across 150–350 Hz band, normalized to eliminate inter-contact variations, and averaged across contacts and trials in each animal (N = 42, 23, and 18 trials in animals 1–3, respectively). The synchronization pattern is similar in all three animals around the time of movement initiation. Bars indicate overall standard deviation from each animals. The arrows mark the channels that were compared, using ANOVA analysis, for statistical significance and the stars represent significant difference for each animal represented by the line color with animal 1 (Blue), animal 2 (red), and animal 3 (magenta). There is a significant difference in all three animals between time points (−0.25, −0.1 s) and (−0.1, 0 s). The time points (0, 0.1 s) showed a significant difference in only animal 1 and animal 2.

