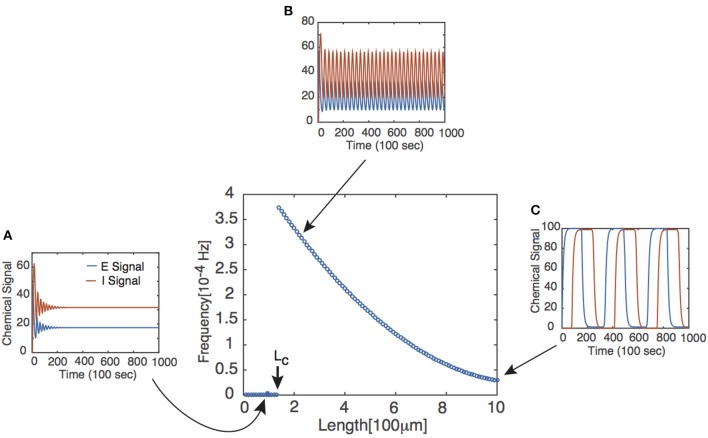
Figure 2.
Frequency of periodic solutions plotted against axonal length. [Plot was obtained by looking at the power spectrum of the retrograde signal and taking the frequency of the signal to be where the sharp peak of the spectrum occurred.] Insets show time series plots at specific values of the delay generated using the dde23 program in MATLAB: (A) τ = 1, (B) τ = 2, (C) τ = 10. Other parameter values are n = 4, I0 = 10, WE = WI = 9.5 such that τc ≈ 1.5.

