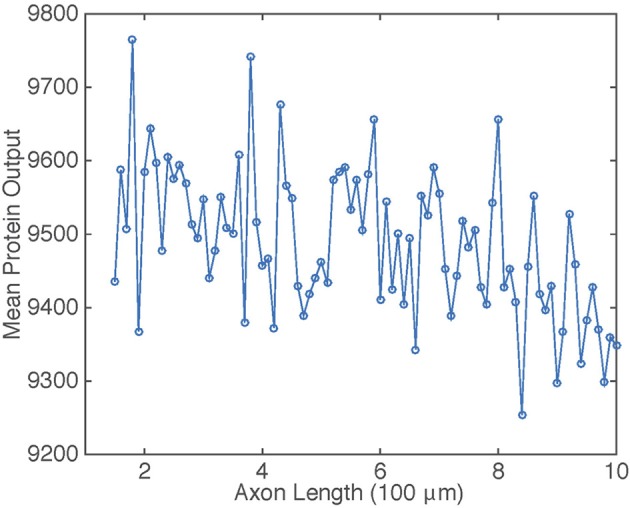
Figure 6.

Plot of mean protein output vs. axonal length L. Results are based on simulations of the chemical master Equation (14) using the Gillespie algorithm with input s(t) = h[uI(t)]. Parameter values used to generate retrograde signal uI(t) are the same as in Figure 2. Other parameter values are β = 1, μ = 0.1, λ = 0.01, and N = 1000.
