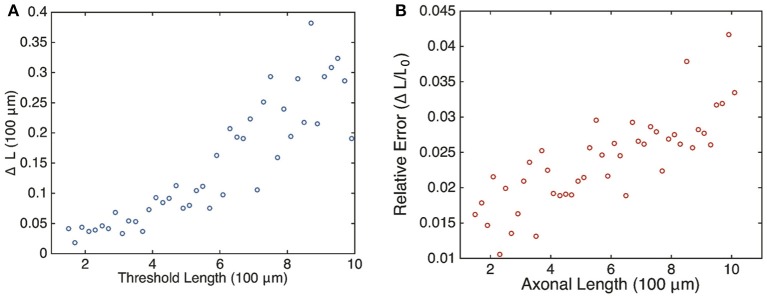
Figure 8.

Plot of estimated errors in axonal length based on 100 simulations of the chemical master Equation (14) using the Gillespie algorithm with input s(t) = h[uI(t)]. (A) Plot of uncertainty in axonal length ΔL vs. threshold axonal lengths L0. (B) Relative error (ΔL ∕ L0) vs. axonal length. Same parameters as Figure 6. L0 was found by averaging over the mean protein outputs and determining what length that protein value corresponded to according to the curve shown in Figure 4. ΔL was determined by looking at what axonal length each individual mean protein output realization corresponded to according to Equation (4) and then finding the variance in this set of values.
