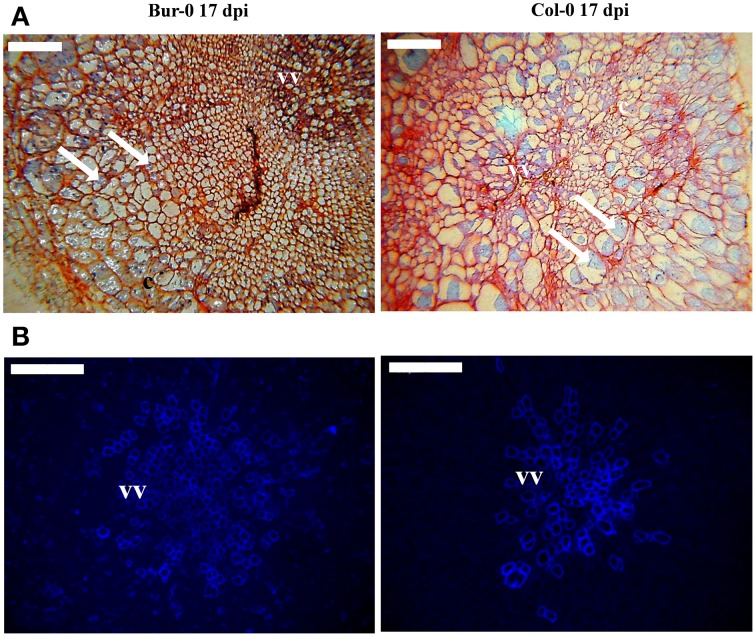
Figure 6.
(A) Safranin and blue cotton and (B) aniline blue stained radial sections of roots infected by Plasmodiophora brassicae in the partially resistant accession Bur-0 and the susceptible accession Col-0. Roots were sampled at 17 dpi, then fixed and immobilized in resin as described in Materials and Methods part. (A,B), Histological sections were cut with a microtome and stained in cotton blue and safranin to visualize pathogen plasmodia (colored in blue in A), plant cell walls (colored in red in A), and vascular vessels colored by aniline blue in (B) respectively. White arrows indicate plasmodia structures in infected cells. For each condition, the image shown is representative of the observations performed on at least six independent root samples. Annotations: vv, vascular vessels; c, cortex. The scale bars indicate 100 μm.

