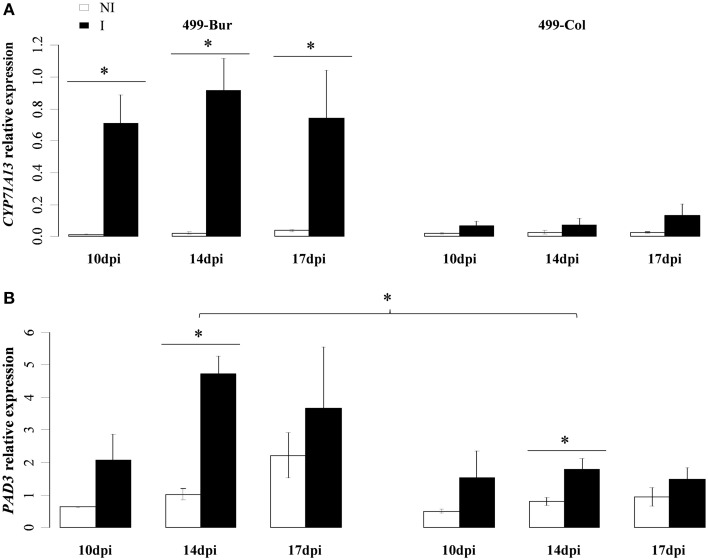
Figure 9.
(A) Transcript levels of CYP71A13 and (B), PAD3 in infected (black bars) and non-infected roots (white bars) of the HIF 499 at 10, 14, and 17 dpi. 499-Bur and 499-Col harbors the Bur-0 and Col-0 allele, respectively, at QTL PbAt5.2. (A,B), Expression levels were normalized using the reference gene PP2A. Error bars represent standard error (Four independent replicates, 12–54 plants per biological replicate). Asterisks indicate statistically significant differences according to the Wald tests applied on a linear mixed model (P < 0.05).

