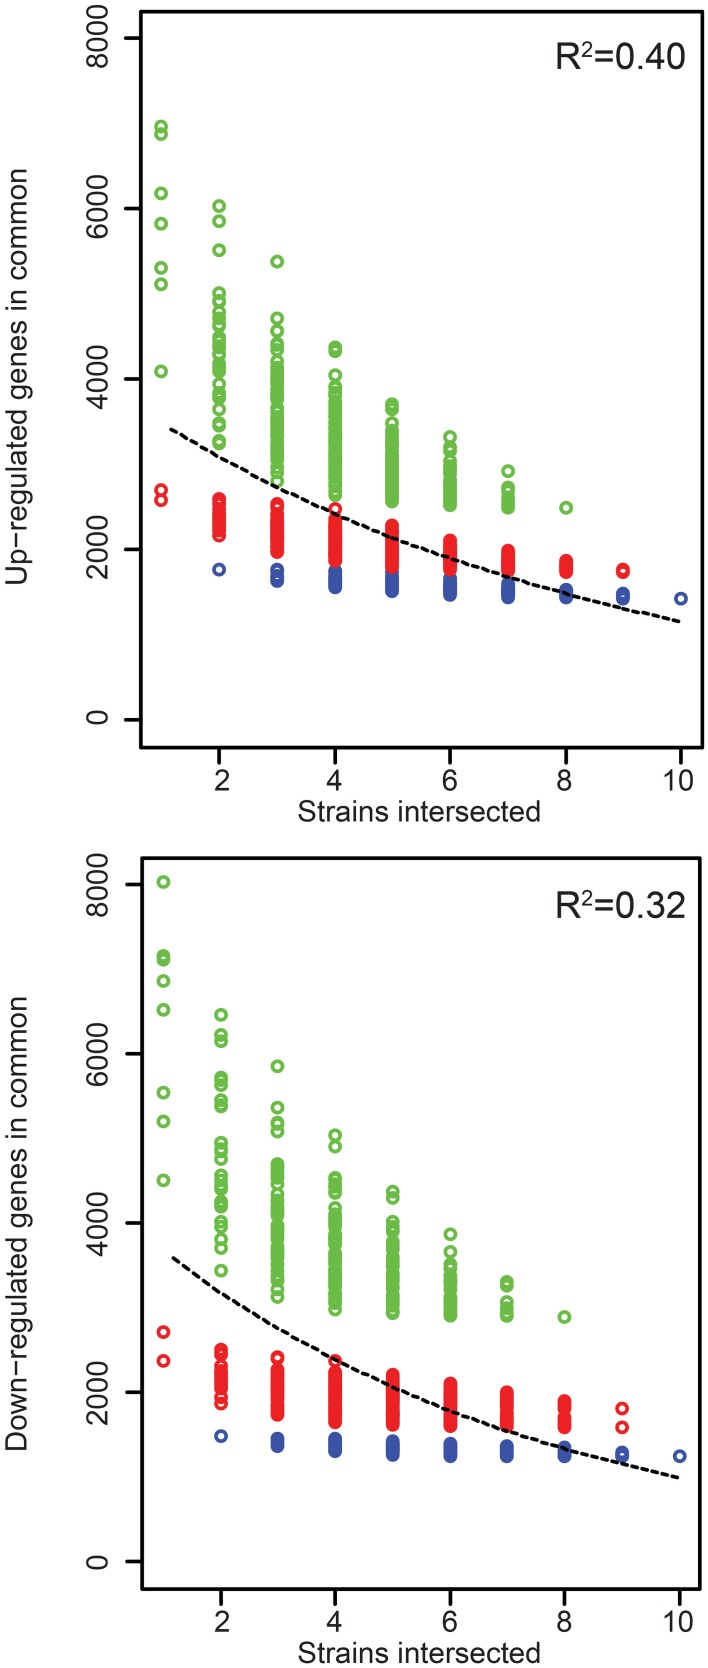
Figure 3.
Rice gene expression changes induced in common by the Xoc strains. The number of genes up- or down- regulated in rice (cv. Nipponbare, at 48 h after syringe infiltration) in common by each of n strains across all possible groups of strains is plotted as a function of n. The least-square fit of an exponential decay function is shown as a dashed line, with R2 values for the fit displayed in the upper-right of each graph. CFBP2286 and BXOR1 induced the fewest gene expression changes (up or down), and this is reflected in stratification of the points in each plot. To make this apparent, groups containing only one of these strains are shown in red and groups containing both in blue.

