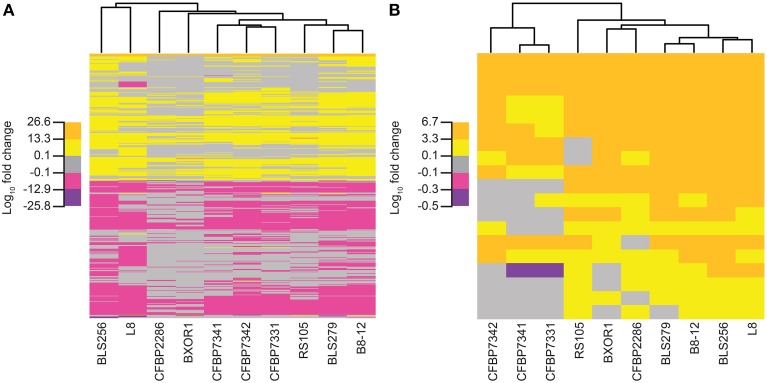
Figure 5.
Relationships of the Xoc strains based on the rice gene expression changes each induces. Trees were created using (A) for each strain, fold change values for all genes that are significantly differently expressed (q ≤ 0.05) at 48 h following syringe infiltration, relative to mock (see Methods) and (B) only the fold change values for the known targets of BLS256 TAL effectors. Each tree was generated by complete linkage clustering based on the Euclidean distance between vectors of log10 fold change. For each tree, five subdivisions of the log10fold change values observed in the data for that tree were used: the minimum, half of the minimum, the maximum, and half of the maximum.

