Figure 2.

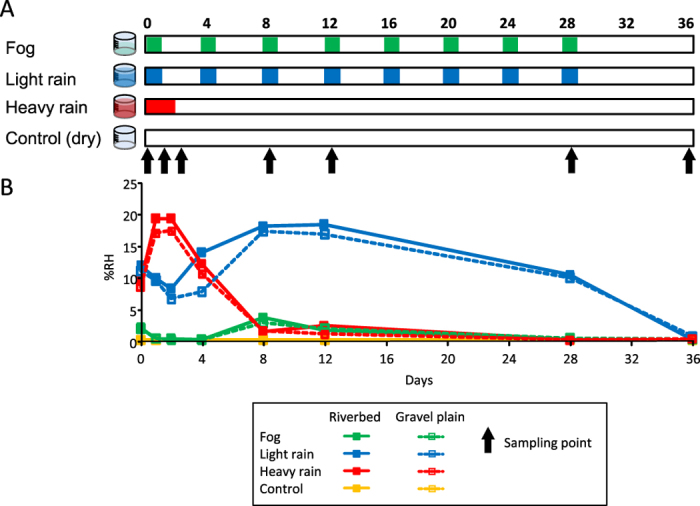
(A) Experimental setup representing the day when each wetting event treatment (F, LR, HR and C) was applied over the 36 days (sampling times are indicated with arrows) and (B) graph of relative humidity (%RH) in the microcosms.

(A) Experimental setup representing the day when each wetting event treatment (F, LR, HR and C) was applied over the 36 days (sampling times are indicated with arrows) and (B) graph of relative humidity (%RH) in the microcosms.