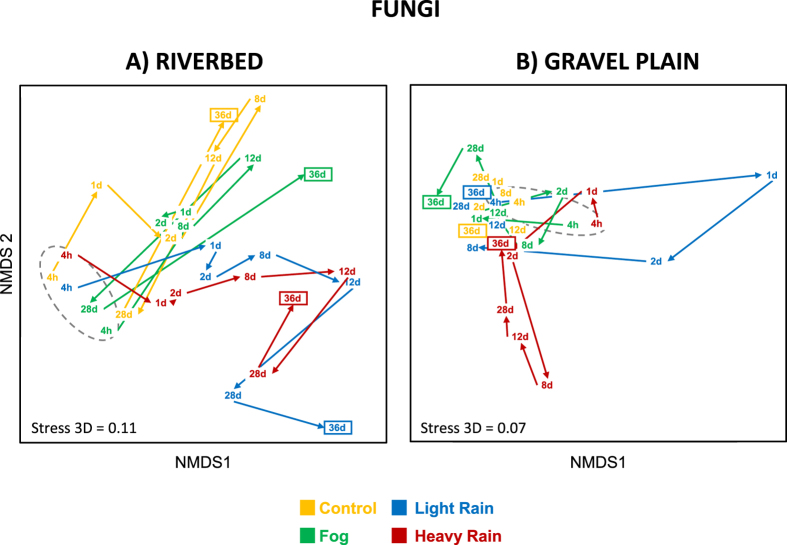
Figure 4.
NMDS ordination of fungal community structure inferred from OTUs relative abundance (obtained from T-RLFPs) originated from the riverbed (A) and gravel plain (B) Different colors denotes for the different water treatments. Points in the ordination are mean of the 3 replicated microcosms per treatment and per sampling time (4 h, 1, 2, 8, 12, 28 and 36 days). Arrows between points revealed the shifting direction of each community between sampling time and grey dashed line surrounds the first sampling time of each treatment.

