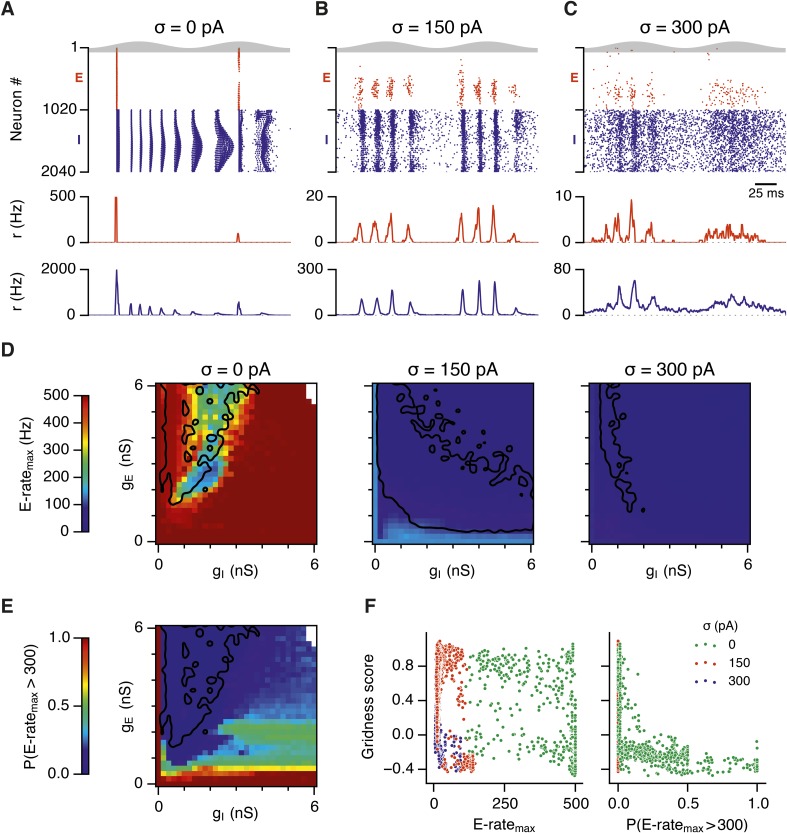
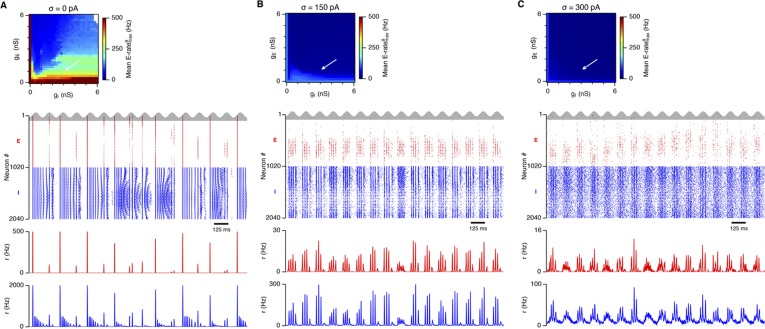
Figure 5. Noise opposes generation of seizure-like states.
(A–C) Raster plots show activity of all neurons in the excitatory (red) and inhibitory (blue) populations for the duration of two theta cycles (top), along with the average population firing rates for both populations (center and bottom; calculated with a sliding rectangular window with 2 ms duration and 0.5 ms time step), for networks where noise is absent (A; σ = 0), with noise set to σ = 150 pA (B), and with noise set to σ = 300 pA (C). Simulations were performed in the absence of animal movement and place cell input; gE = 1 nS and gI = 3 nS. (D) Maximal average population firing rate of E cells estimated from the whole simulation run (10 s; 500 ms at the beginning of the simulation excluded) for each simulated level of noise. Each point is an average of maxima from five simulation runs. (E) Probability of the maximal population-average firing rate during each theta cycle exceeding 300 Hz, that is, at least 60% of E cells firing synchronously within a time period of 2 ms in the parameter space of gE and gI when σ = 0 pA. Black lines indicate regions where gridness score equals 0.5. (F) Scatter plots show the relationship between gridness score and the maximal firing rate during the simulation (left) and the probability of the maximal population-average firing rate during each theta cycle exceeding 300 Hz (right).


