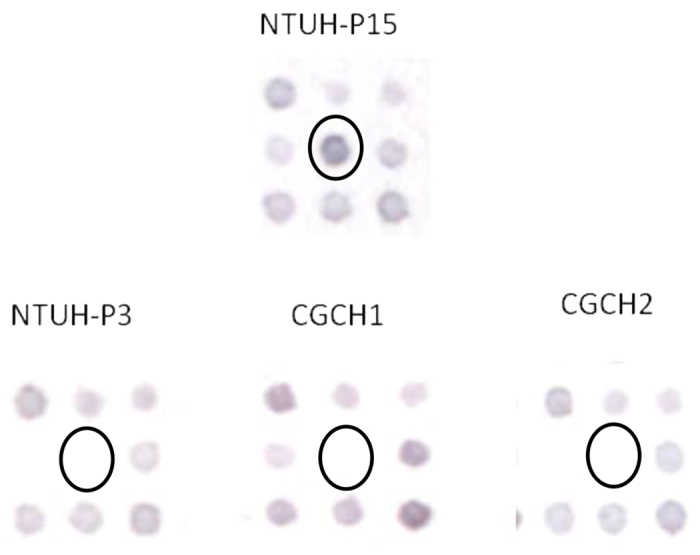
Figure 1. DNA hybridization and colorimetric detection of NTUH-P15 and 3 non-clonal expansion strains on microarray analysis.

Each spot represents one clone. The spot showing significant increases in hybridization signals in the NTUH-P15 strain compared with the other three strains are circled. Spots showing no significant increases in hybridization signals in the NTUH-P15 strain compared with the other three strains are not circled.
