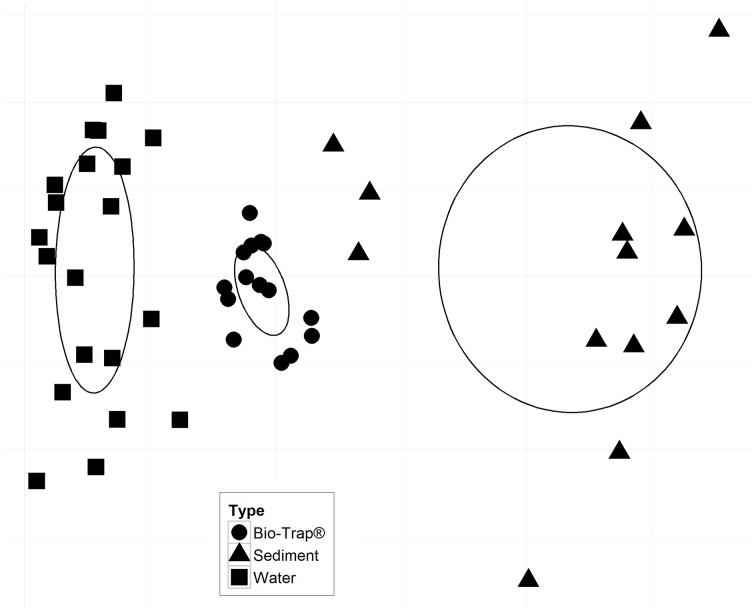
Figure 4.
Non-metric multidimensional scaling (NMDS) plot based on a Bray-Curtis dissimilarity matrix; stress = 0.082. Ellipses represent the standard error of the weighted average of scores of samples, and the direction of the principal axis of the ellipse is defined by the weighted correlation of samples. There were no statistically significant environmental vectors (p-value < 0.05).

