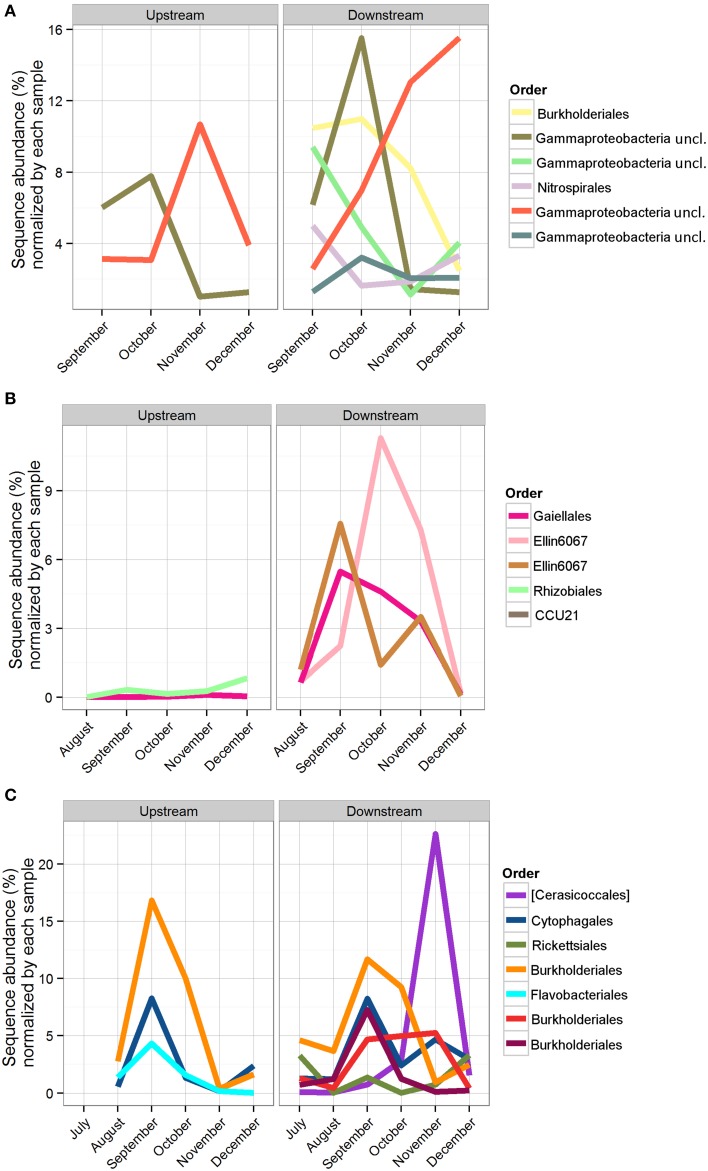
Figure 7.
Sequence abundance of OTUs present for the duration of the study, normalized by the total abundance of sequences in the sample. Each OTU is colored by its taxonomic order, and the same color represents the same OTU across locations. (A) Bio-Trap® samples, triplicates were averaged for the sequence abundances; (B) Sediment samples; (C) Water samples.

