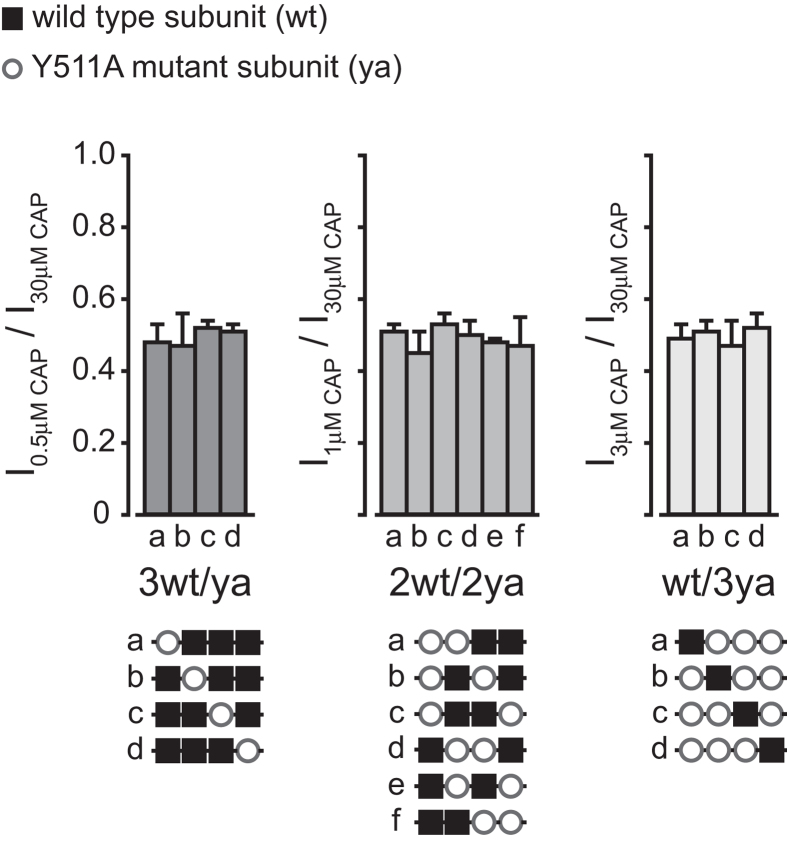
Figure 5. Activation of TRPV1 by capsaicin displays channel symmetry.
Bar diagram representing the average (±SEM) amplitude of the whole-cell currents for each indicated group of tandem constructs evoked by the relative capsaicin concentration (3wt/ya group: 0.5 μM, left bars; 2wt/2ya group: 1 μM, middle bars; wt/3ya group: 3 μM, right bars) normalized to the current amplitude of 30 μM capsaicin (I30μM CAP). Tested conditions were used according to the dose response determined in Fig. 4d. Below each bar diagram are schematic Illustrations of the different tandem constructs used to study the symmetry of the capsaicin response. Black squares represent wt subunits (wt) and empty circles represent subunits with a mutated VBS in position Y511A (ya). Holding potential −40 mV. Each bar represents 4–7 HEK293T cells transiently expressing the respective construct. Statistical significance was determined with the unpaired Student’s t tests. No statically significant differences were found.

