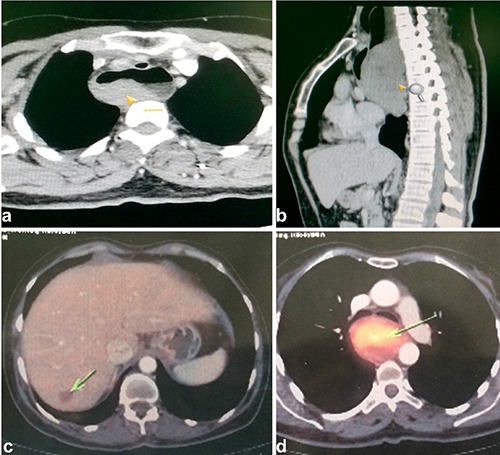
Figure 1.

a,b) Contrast enhanced computed tomography (CT) chest images showing the intramural mass (arrow) in the right posterolateral wall of esophagus in axial and sagittal sections respectively. c) Positron emission CT (PET CT) showing non 18-fluoro deoxy glucose avid lesion (arrow) in segment Vll of liver. d) PET CT showing the FDG avid esophageal mass (arrow) of standardized uptake value 2.
